. 2017 Nov 24;8(1):1768.
doi: 10.1038/s41467-017-01874-w.

Feature-based learning improves adaptability without compromising precision

Affiliations

Feature-based learning improves adaptability without compromising precision

Shiva Farashahi et al. Nat Commun. .

Abstract

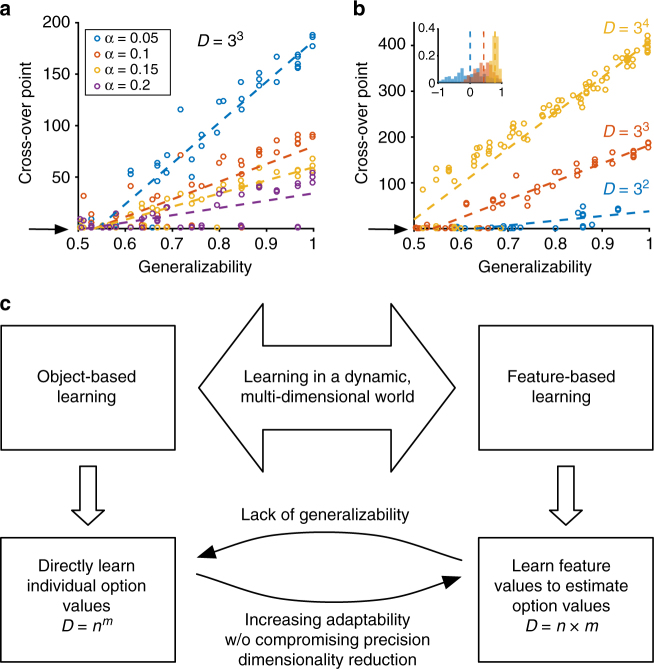
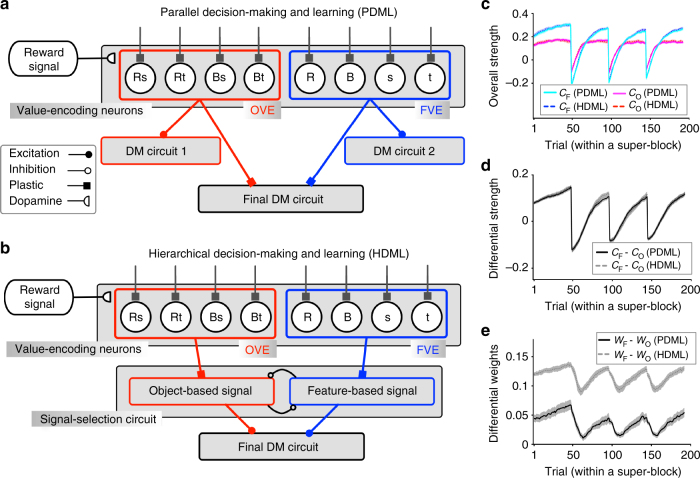
Learning from reward feedback is essential for survival but can become extremely challenging with myriad choice options. Here, we propose that learning reward values of individual features can provide a heuristic for estimating reward values of choice options in dynamic, multi-dimensional environments. We hypothesize that this feature-based learning occurs not just because it can reduce dimensionality, but more importantly because it can increase adaptability without compromising precision of learning. We experimentally test this hypothesis and find that in dynamic environments, human subjects adopt feature-based learning even when this approach does not reduce dimensionality. Even in static, low-dimensional environments, subjects initially adopt feature-based learning and gradually switch to learning reward values of individual options, depending on how accurately objects' values can be predicted by combining feature values. Our computational models reproduce these results and highlight the importance of neurons coding feature values for parallel learning of values for features and objects.


Conflict of interest statement

The authors declare no competing financial interests.

Figures

Fig. 1
Fig. 1
A framework for understanding model adoption during learning in dynamic, multi-dimensional environments. a Cross-over point is plotted as a function of the generalizability index of the environment for different values of the learning rate. The cross-over point increases with generalizability and decreases with the learning rate. The larger learning rate, however, comes at the cost of more noise in estimation (lower precision). The arrow shows zero cross-over point indicating that the object-based learning is always superior for certain environments. b Cross-over point is plotted as a function of generalizability separately for environments with different values of dimensionality (for α = 0.05). The advantage of feature-based over object-based learning increases with larger dimensionality. The inset shows the distribution of the generalizability index in randomly generated environments for three different dimensionalities. c The object-based approach for learning multi-dimensional options/objects requires learning n m values, where there are m possible features and n instances per feature in the environment, whereas the feature-based approach requires learning only n×m values resulting in a dimensionality reduction equal to (n mn×m). A feature-based approach, however, is beneficial if there are generalizable rules for estimating the reward values of options based on the combination of features’ values. A lack of generalizability should encourage using the object-based approach. Finally, frequent changes in reward contingencies (dynamic environment) should increase the use of feature-based learning because it allows update of multiple features based on a single feedback and thus increases adaptability without compromising precision
Fig. 2
Fig. 2
Dynamic reward schedules promote feature-based learning whereas a lack of generalizability promotes object-based learning. a Performance or the average reward harvested by subjects during Experiments 1 (generalizable environment) and 2 (non-generalizable environment). Dashed lines show the mean performance and solid lines show the threshold used for excluding subjects whose performance was not distinguishable from chance (0.5). b Plotted is the Bayesian information criterion (BIC) based on the best feature-based or object-based models, separately for each environment. The insets show histograms of the difference in BIC from the two models for the generalizable (blue) and non-generalizable (red) environments. The dashed lines show the medians and the stars indicate significant difference from zero (two-sided rank-sum, P < 0.05). Subjects were more likely to adopt a feature-based approach in the generalizable environment and an object-based approach in the non-generalizable environment. c, d Time course of learning during each block of trials in Experiments 1 and 2. Plotted are the average harvested reward  (c) and probability of selecting the better option (d) in a given trial within a block across all subjects (the shaded areas indicate s.e.m.). The dashed line shows chance performance. The solid blue and red lines show the maximum performance based on the feature-based approach in the generalizable and non-generalizable environments, respectively, assuming that the decision maker selects the more rewarding option based on this approach on every trial. The maximum performance for the object-based approach was similar in the two environments, and equal to that of the feature-based approach in the generalizable environment
Fig. 3
Fig. 3
Transition from feature-based to object-based learning in static, non-generalizable environments. a The time course of performance during Experiment 3. The running average over time is computed using a moving box with the length of 20 trials. Shaded areas indicate s.e.m., and the dashed line shows chance performance. The red and blue solid lines show the maximum performance using the feature-based and object-based approaches, respectively, assuming that the decision maker selects the more rewarding option based on a given approach in every trial. Arrows mark the locations of estimation blocks throughout a session. For some subjects, there were only five estimation blocks indicated by black arrows. b The time course of model adoption measured by fitting subjects’ estimates of reward probabilities. Plotted is the relative weight of object-based to the sum of the object-based and feature-based approaches, and explained variance in estimates (R 2) over time. Dotted lines show the fit of data based on an exponential function. c Plotted is the fraction of subjects who showed a stronger correlation between their reward estimates and actual reward probabilities than the probabilities estimated using the reward values of features. The dotted line shows the fit of data based on an exponential function. d Transition from feature-based to object-based learning revealed by the average goodness-of-fit over time. Plotted are the average negative log likelihood based on the best feature-based model, best object-based RL model, and the difference between object-based and feature-based models during Experiment 3. Shaded areas indicate s.e.m., and the dashed line shows the measure for chance prediction. eh The same as in ad, but during Experiment 4.
Fig. 4
Fig. 4
Subjects who adopted feature-based learning updated their preference even for other objects that contained a feature of the object selected on the previous trial based on the reward outcome. ad Plotted are the feature-based (blue) and object-based (red) differential responses for subjects who adopted feature-based learning in a given experiment. The dashed lines show the median values across subjects and a star indicates significant difference from zero (one-sided sign-rank test, P < 0.05). The solid lines show the average simulated differential response using the estimated parameters based on the fit of each subject’s data. eh The same as in ad but for subjects who adopted object-based learning in each experiment
Fig. 5
Fig. 5
Feature-based learning was stronger for the more informative feature. ad Plotted is the log product of the estimated learning rate (α) and assigned weight (w) for the less informative feature (non-informative in the case of Experiments 2–4) vs. of the same product for the more informative feature for each individual, across four experiments. The insets show the histogram of difference in (α×w) between the more and less informative features. The dashed lines show the medians and the solid gray lines indicate zero. The star shows that the median of the difference in (α×w) were significantly different from 0 (one-sided sign-rank test, P < 0.05). These products were larger for the more informative feature in all experiments. eh. Plotted is the feature-based differential response for the less informative feature vs. the more informative feature. Conventions are the same as in ad. The feature-based differential response was larger for the more informative feature in all experiments (though it did not achieve significance in Experiments 2 and 3), indicating that subjects updated their behavior more strongly for the more informative feature
Fig. 6
Fig. 6
Architectures and performances of two alternative network models for multi-dimensional, decision-making tasks. a, b Architectures of the PDML (a) and the HDML (b) models. In both models, there are two sets of value-encoding neurons that estimate reward values of individual objects (object-value-encoding neurons, OVE) and features (feature-value-encoding neurons, FVE). The two models are different in how they combine signals from the OVE and FVE neurons and how the influence of these signals on the final decision is adjusted through reward-dependent plasticity. c The time course of the overall strengths of plastic synapses between OVE and FVE neurons and the final DM circuit (C O and C F) in the PDML model, or between OVE and FVE neurons and the signal-selection circuit (C O and C F) in the HDML model. These simulations were done for the generalizable environment (Experiment 1) where the block length was 48. d The difference between the C F and C O over time in the two models. e The difference in the overall weights of the two sets of value-encoding neurons on the final decision (W FW O) for the same set of simulations shown in c, d
Fig. 7
Fig. 7
Replicating the pattern of experimental data using the PDML and HDML models. a Comparison of the goodness-of-fit in for the data generated by the PDML model in Experiments 1 (generalizable) and 2 (non-generalizable) using the object-based and feature-based RL models with decays. The insets show histograms of the difference in the negative log likelihood (-LL) based on the fits of the two models. In contrast to the experimental data, choice behavior of the PDML model in Experiment 1 was equally fit by the object-based and feature-based models. b The time course of model adoption in the PDML model. Plotted is the relative weight of object-based to the sum of the object-based and feature-based weights, and explained variance in estimates (R 2) over time in Experiment 3. Dotted lines show the fit of data based on an exponential function. c Transition from feature-based to object-based learning in the PDML model. Plotted are the average negative log likelihood based on the best feature-based model, best object-based RL model, and the difference between object-based and feature-based models in Experiment 3. Shaded areas indicate s.e.m., and the dashed line shows the measure for chance prediction. d, e The same as in b, c, but for simulations of Experiment 4. fj The same as in ae, but for the HDML model. Although both models qualitatively replicated the pattern of experimental data in Experiments 2–4, only the behavior of HDML model was consistent with data in Experiment 1

References

    1. Barto AG, Mahadevan S. Recent advances in hierarchical reinforcement learning. Discrete Event Dyn. Syst. 2003;13:341–379. doi: 10.1023/A:1025696116075. - DOI
    1. Diuk C, Tsai K, Wallis J, Botvinick M, Niv Y. Hierarchical learning induces two simultaneous, but separable, prediction errors in human basal ganglia. J. Neurosci. 2013;33:5797–5805. doi: 10.1523/JNEUROSCI.5445-12.2013. - DOI - PMC - PubMed
    1. Hastie, T., Tibshirani, R. & Friedman, J. The Elements of Statistical Learning: Data Mining, Inference and Prediction 1st edn (Springer-Verlag, New York, 2001).
    1. Sutton, R. S. & Barto, A. G. Reinforcement Learning: an Introduction. (Cambridge, MA: MIT Press, 1998).
    1. Niv Y, et al. Reinforcement learning in multidimensional environments relies on attention mechanisms. J. Neurosci. 2015;35:8145–8157. doi: 10.1523/JNEUROSCI.2978-14.2015. - DOI - PMC - PubMed

Publication types

LinkOut - more resources