. 2017 Nov 23;7(1):16140.
doi: 10.1038/s41598-017-15721-x.

Methylomic and phenotypic analysis of the ModH5 phasevarion of Helicobacter pylori

Affiliations

Methylomic and phenotypic analysis of the ModH5 phasevarion of Helicobacter pylori

Yogitha N Srikhanta et al. Sci Rep. .

Abstract

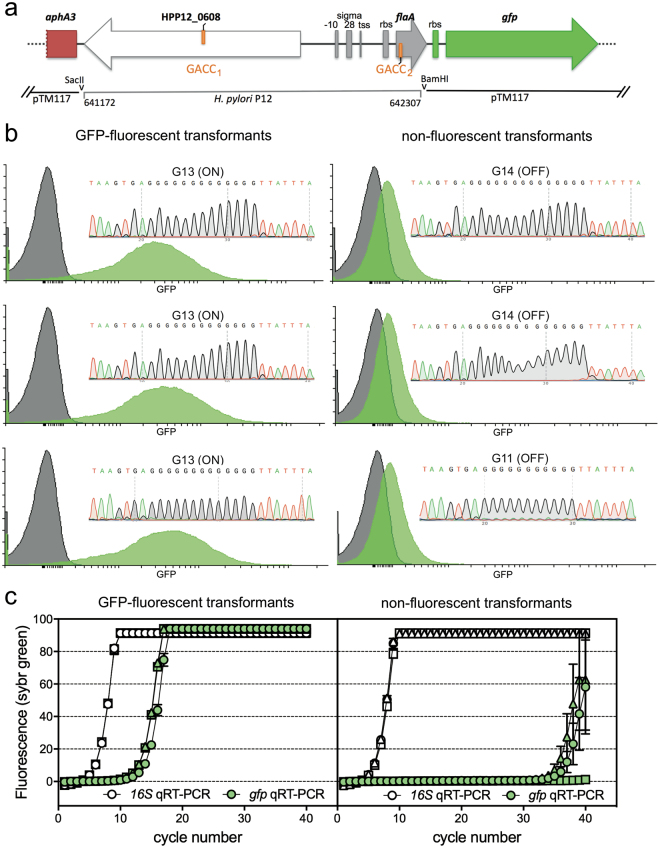
The Helicobacter pylori phase variable gene modH, typified by gene HP1522 in strain 26695, encodes a N6-adenosine type III DNA methyltransferase. Our previous studies identified multiple strain-specific modH variants (modH1 - modH19) and showed that phase variation of modH5 in H. pylori P12 influenced expression of motility-associated genes and outer membrane protein gene hopG. However, the ModH5 DNA recognition motif and the mechanism by which ModH5 controls gene expression were unknown. Here, using comparative single molecule real-time sequencing, we identify the DNA site methylated by ModH5 as 5'-Gm6ACC-3'. This motif is vastly underrepresented in H. pylori genomes, but overrepresented in a number of virulence genes, including motility-associated genes, and outer membrane protein genes. Motility and the number of flagella of H. pylori P12 wild-type were significantly higher than that of isogenic modH5 OFF or ΔmodH5 mutants, indicating that phase variable switching of modH5 expression plays a role in regulating H. pylori motility phenotypes. Using the flagellin A (flaA) gene as a model, we show that ModH5 modulates flaA promoter activity in a GACC methylation-dependent manner. These findings provide novel insights into the role of ModH5 in gene regulation and how it mediates epigenetic regulation of H. pylori motility.


Conflict of interest statement

Y.N.S., R.J.G., P.M.P., K.T., E.L.H., M.P.J. and T.K. declare no competing interests; M.B., T.A.C. and J.K. are full-time employees at Pacific Biosciences, a company developing single-molecule sequencing technologies.

Figures

Figure 1
Figure 1
Over- and under-representation of GACC-related tetranucleotide motifs in Helicobacter species and naturally competent non-Helicobacter species. Tetranucleotide representation in: (a) H. pylori chromosomal DNA tetranucleotide representation, modH type in brackets; and (b) H. pylori plasmid DNA, plasmid size and modH type in brackets. Tetranucleotide extremes were examined using Signature (Institute of Bioinformatics, University of Georgia) to determine Karlin’s tau (τwxyz) values whereby <0.72 (dashed line) or >1.28 (dotted line) indicate significantly underrepresented or overrepresented tetranucleotide motifs, respectively.
Figure 2
Figure 2
GACC distribution on H. pylori P12 genome. (a) Forward strand (1340 GACC sites) and reverse strand (1240 GACC sites) of the P12 genome. From outside track: turquoise-ORFs; GACC frequency, orange–high, green–low; %GC content, pink–high, purple–low. Red bars denote areas of interest in the P12 genome (clockwise): comB, including type IV secretion system (TFSS) 2; PZ1–plasticity zone 1, including TFSS4; cagPAI–cag PAI pathogenicity island, including TFSS1; PZ2–plasticity zone 2; PZ3–plasticity zone 3, including TFSS3. (b) Distribution of the number of GACC sites in 500 bp region upstream of all P12 genes. (c) Distribution of the number of GACC sites in all P12 genes. (d) There was a significant positive correlation between the number of GACC sites within a gene and the length of the gene (Spearman’s correlation).
Figure 3
Figure 3
ModH5 ON/OFF state differentially modulates H. pylori P12 motility. GACC ModH5-target sites are overrepresented in essential motility genes flaA (a) and flgE-1 (b), which have both previously been shown to be transcriptionally modulated by modH5 ON/OFF state. The schematics show the known promoter features (filled boxes) and open reading frames (filled arrow) of the motility genes, and their flanking genes (open arrows). (c) Representative motility images of modH5 ON (P12 wt), modH5 OFF and ΔmodH5 strains stabbed into soft agar; images captured at 5 days post-inoculation; the addition of tetrazolium chloride to the soft agar allowed visualisation of the distance travelled (outer red ring) over time; scale bar = 5 mm. (d) Comparative motility of modH5 ON (P12 wt), modH5 OFF and ΔmodH5 strains; bars denote mean ± SD (each symbol represents the mean of technical replicates from an individual experiment; P12 wt and P12ΔmodH5, N = 4 independent experiments; P12 modH5 OFF, N = 3 independent experiments); P-values determined by two-way ANOVA, *P < 0.05, ****P < 0.0001 denote significant enhancement in motility of P12 wt compared to isogenic OFF strains; significant migration of each strain between d3 and d5 indicated beneath each d5 dot plot.
Figure 4
Figure 4
ModH5 ON/OFF state differentially modulates H. pylori P12 flagella number. (a) Paraformaldehyde-fixed, broth-cultured H. pylori modH5 ON (P12 wt), modH5 OFF and ΔmodH5 strains were adsorbed onto formvar copper grids, negative stained with ammonium molybdate and imaged by transmission electron microscopy; 3 representative images shown of each strain (scale bar = 1 μm). Individual bacterial cells were assessed using Fiji ImageJ software for (b) number of flagella per cell (magnification 8000x), (c) flagella length (magnification 8000x), and (d) flagella width (magnification 50,000x). P-values were determined by Kruskal-Wallis test with Dunn’s multiple comparison post-test; *P < 0.05, **P < 0.01, ***P < 0.001, ****P < 0.0001; all other comparisons not significantly different. Sample sizes for each group shown in parentheses.
Figure 5
Figure 5
ModH5-mediated methylation of the flaA promoter region modulates downstream gene expression. (a) pTM117-flaA reporter construct design. DNA containing GACC sites upstream of, and at the start of, the P12 flaA ORF was inserted upstream of a promoterless gfpmut3 gene within plasmid pTM117. (b) Transformation of H. pylori modH5 strain 7.13 resulted in both GFP-fluorescent and non-fluorescent kanamycin-resistant transformants as measured by flow cytometric analysis of transformants (green peak) compared to parental 7.13 (grey peak); x-axis denotes GFP fluorescence intensity and y-axis denotes number of cells. Inset chromatograms of the polyG-tract in modH5 gene of each transformant showing the GFP-fluorescent clones were modH5-ON and the non-fluorescent clones were modH5-OFF. (c) gfp mRNA levels in GFP-fluorescent versus non-fluorescent transformants as determined by qPCR using 16S-specific and gfp-specific qPCR of random primed cDNA generated from bacterial RNA. Three independent transformants were assessed per fluorescence phenotype; each symbol type (circle, triangle or square) represents an individual clone; open symbol = 16S qRT-PCR, filled symbol = gfp qRT-PCR; each point represents mean (±SD) of technical triplicates.
Figure 6
Figure 6
ModH5-mediated methylation of the flaA promoter region at site GACC1 modulates downstream gene expression. (a) pTM117-flaA reporter construct carrying either GACC1 (wt promoter) or GCCC1 (A > C synonymous substitution mutant) was used to transform H. pylori modH5 strain 7.13 wt; “Epi” - total population of kanamycin-resistant transformants imaged by epi-luminescence (colonies false coloured red in ImageJ); “GFP” - fluorescent transformants imaged using a GFP-specific filter (colonies false coloured green in ImageJ); “Overlay” shows proportion of GFP-fluorescent transformants (yellow/green) to non-fluorescent transformants (red). (b) Sequencing of the modH5 G-tract in GFP-fluorescent (GFP +ve) and non-fluorescent (GFP −ve) transformants carrying pTM117-flaA with GACC1 versus GCCC1 showed that the correlation between ModH5 activity and P12 flaA promoter function was uncoupled upon loss of the upstream ModH5 methylation site (GACC1). P-values were determined using Fisher’s exact test; ****P < 0.0001, NS = not signficant.

References

    1. Moss SF, Sood S. Helicobacter pylori. Curr. Opin. Infect. Dis. 2003;16:445–451. doi: 10.1097/00001432-200310000-00011. - DOI - PubMed
    1. Peek RM, Jr, Crabtree JE. Helicobacter infection and gastric neoplasia. J. Pathol. 2006;208:233–248. doi: 10.1002/path.1868. - DOI - PubMed
    1. Blaser MJ. Ecology of Helicobacter pylori in the human stomach. J. Clin. Invest. 1997;100:759–762. doi: 10.1172/JCI119588. - DOI - PMC - PubMed
    1. Ernst PB, Gold BD. The disease spectrum of Helicobacter pylori: the immunopathogenesis of gastroduodenal ulcer and gastric cancer. Annu. Rev. Microbiol. 2000;54:615–640. doi: 10.1146/annurev.micro.54.1.615. - DOI - PubMed
    1. Moxon ER, Thaler DS. Microbial genetics. The tinkerer’s evolving tool-box. Nature. 1997;387:661–662. - PubMed

Publication types

MeSH terms

Substances