. 2017 Nov 23;8(1):1741.
doi: 10.1038/s41467-017-01886-6.

A structurally distinct TGF-β mimic from an intestinal helminth parasite potently induces regulatory T cells

Affiliations

A structurally distinct TGF-β mimic from an intestinal helminth parasite potently induces regulatory T cells

Chris J C Johnston et al. Nat Commun. .

Abstract

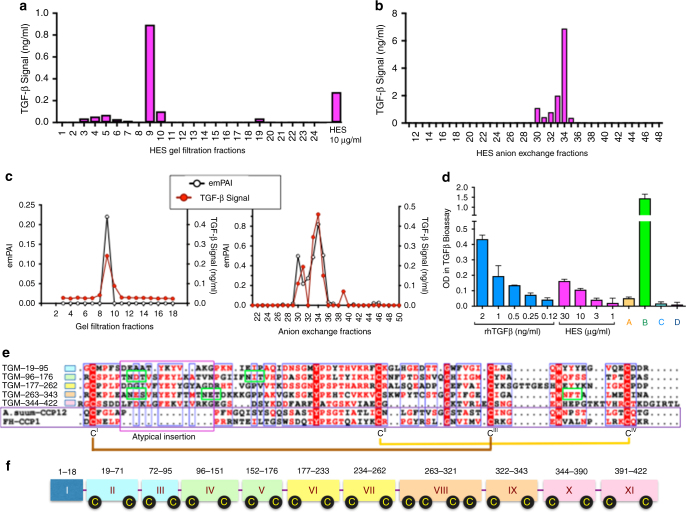
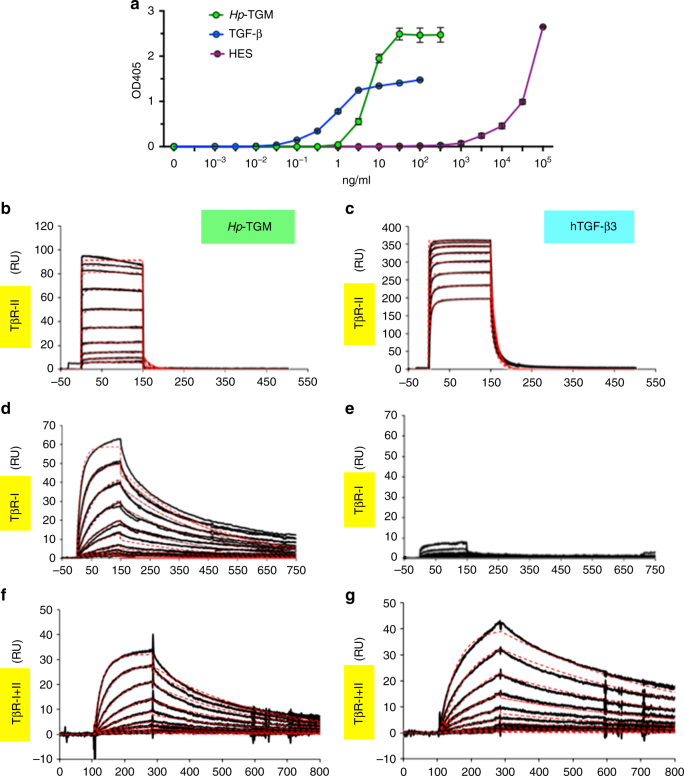
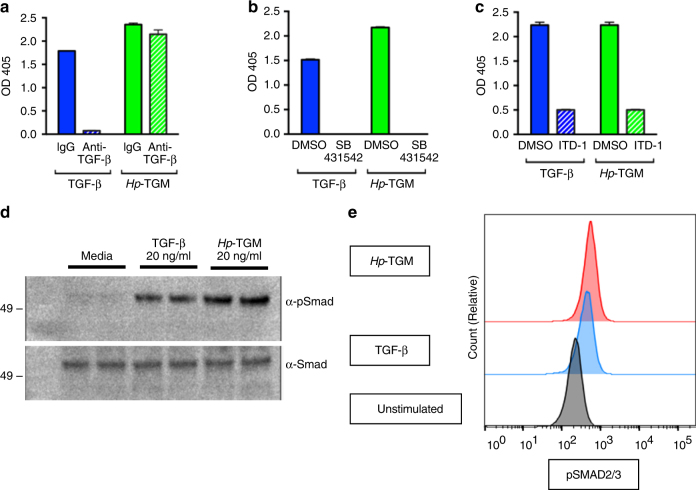
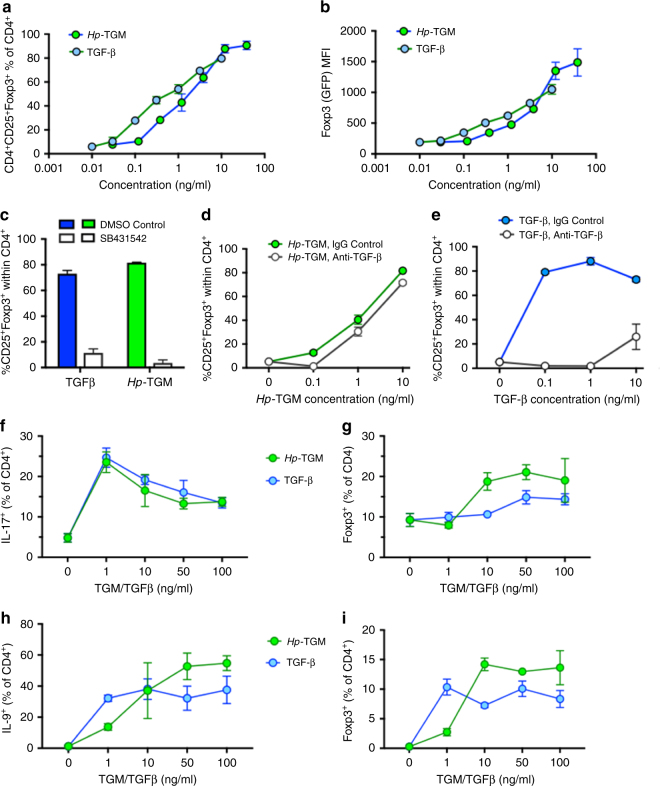
Helminth parasites defy immune exclusion through sophisticated evasion mechanisms, including activation of host immunosuppressive regulatory T (Treg) cells. The mouse parasite Heligmosomoides polygyrus can expand the host Treg population by secreting products that activate TGF-β signalling, but the identity of the active molecule is unknown. Here we identify an H. polygyrus TGF-β mimic (Hp-TGM) that replicates the biological and functional properties of TGF-β, including binding to mammalian TGF-β receptors and inducing mouse and human Foxp3+ Treg cells. Hp-TGM has no homology with mammalian TGF-β or other members of the TGF-β family, but is a member of the complement control protein superfamily. Thus, our data indicate that through convergent evolution, the parasite has acquired a protein with cytokine-like function that is able to exploit an endogenous pathway of immunoregulation in the host.


Conflict of interest statement

The authors declare no competing financial interests.

Figures

Fig. 1
Fig. 1
Identification of Hp-TGM. a Fractionation of HES by gel filtration FPLC. 1 mg of HES was separated on a Superdex 200 10/300 GL column and 1 ml fractions collected for assay with MFB-F11 reporter cells; responses were calibrated with recombinant human TGF-β1. b as a, fractionation by ion exchange FPLC on a Mono QTM 5/50 G column. c Abundance of a candidate protein, Hp_I03161_IG00349_L1408, calculated by the exponentially modified Protein Abundance Index (emPAI) in each fraction, compared to the activation of TGFβ-responsive cells by the same fraction. d TGF-β bioassay screen of four candidate recombinant clones designated A–D; clone B corresponds to candidate Hp_I03161_IG00349_L1408 shown in panel c. Supernatants of cells transfected with clones A–D were assayed in duplicate, and mean values ± SEM are shown. Two-tailed t tests found Clone B to be significantly (p < 0.05) higher than all others. e Alignment of five similar domains within Hp-TGM encompassing the entire amino acid sequence apart from the predicted signal peptide (aa 1–18), with conserved cysteine (white on red) and other residues indicated, together with a Complement Control Protein (CCP) module from the nematode Ascaris suum (domain 12 of ASU_08405, aa 954–1018), and an archetypal CCP domain, human Factor H module 1 (X07523, aa 20–83). Other conserved residues are shown in red and potential N-glycosylation sites outlined in green. Amino acid positions for each domain of Hp-TGM are indicated on the left. Note the presence of a 15-aa insertion near the N-terminal of each domain of Hp-TGM which is not typical of the CCP family. Positions of disulfide bonds in Factor H are shown below the alignment by linked cysteine residues CI – CIV. f Exon-intron structure of Hp-TGM in the H. polygyrus genome; domains are colored corresponding to symbols in panel e; positions of cysteine residues indicated in black circles
Fig. 2
Fig. 2
Binding of Hp-TGM to the TGF-β Receptors. a MFB-F11 TGF-β-responsive bioassay for activity following 24 h of culture at 37 °C, comparing Hp-TGM to hTGF-β1 and the complex HES mixture by protein concentration. MFB-F11 cells are transfected with a Smad-responsive plasmid construct in which TGF-β binding leads, through Smad phosphorylation and nuclear translocation, to expression of alkaline phosphatase, which is measured following the addition of p-nitrophenyl phosphate. Data shown are representative of  > 3 independent experiments, and represent mean ± SEM from duplicate wells. be Surface plasmon resonance analysis of Hp-TGM and hTGF-β3 binding to hTGF-β receptors. Streptavidin-coated biosensor chips were loaded with biotinylated Hp-TGM or hTGF-β3 and two-fold dilutions of the ectodomain of hTβRII (from 13 µM downwards) b, c and of the ectodomain of hTβRI (from 4 µM downwards) d, e were passed over the Hp-TGM or hTGF-β3 surface, respectively. Data shown are from one of two similar experiments. f, g Surface plasmon resonance analysis of Hp-TGM and hTGF-β3 binding to TβRI in the presence of near-saturating TβRII (2 μM), showing independent binding by Hp-TGM to both receptors, but binding of hTGF-β3 to TβRI dependent on the presence of TβRII
Fig. 3
Fig. 3
Hp-TGM signals through the TGF-β pathway. a Activity shown from MFB-F11 bioassay after 24 h of culture at 37 °C with hTGF-β1 or Hp-TGM incubated with anti-TGF-β monoclonal antibody or MOPC31C IgG control. Data shown are representative of two independent experiments, and represent mean ± SEM from duplicate wells; analysis by multiple t tests shows antibody significantly reduces effect of TGF-β (P < 0.0001), but has no significant effect on TGM. b, c Abolition of signaling by inhibitors of the TGF-β receptor kinases. Activity shown from MFB-F11 bioassay after 24 h of culture of TGF-β and Hp-TGM at 37 °C with: b the TβRI inhibitor, SB431542 or DMSO control and c the TβRII inhibitor, ITD-1 (10 µM). Data shown are representative of ≥ 2 independent experiments, and represent mean ± SEM from duplicate wells. Analysis by multiple t tests shows that effects of both mediators are significantly reduced by SB431542 (p < 0.0001) and ITD-1 (P < 0.001). d Western blots (Smad2 and phospho-Smad2): cell lysates from C57BL/6 splenocytes following culture at 37 °C for 18 h. Culture conditions in duplicate: media (DMEM + 2.5% FCS), media supplementted with 20 ng/ml hTGF-β1 and media supplemented with 20 ng/ml Hp-TGM. Position of a 49-kDa marker protein detected by negative staining is marked on each blot. e Phospho-Flow analysis with anti-phospho-Smad2/3 on murine CD4+ T cells stimulated for 16 h with 20 ng/ml of Hp-TGM or hTGF-β1, before permeabilization and staining with specific antibody. A representative individual histogram is displayed
Fig. 4
Fig. 4
Hp-TGM induces T cell Foxp3 expression even in proinflammatory conditions. a, b CD4+CD25GFPCD62Lhi murine naive T cells were stimulated with plate-bound anti-CD3/CD28 for 4 days in culture with 100 U/ml IL-2 and variable concentrations of Hp-TGM or hTGF-β1, before flow cytometric analysis of CD4, CD25 and Foxp3 expression; 2 technical replicates per concentration; representative of 4 independent experiments;. a: percentage of CD25+Foxp3+ cells among total CD4+ cells; b, Mean fluorescence intensity (MFI) of Foxp3 among Foxp3+ cells. Gating strategy is shown in Supplementary Fig. 6. ce Foxp3 induction in the same conditions as a, in the presence of SB431542 inhibitor c or pan-vertebrate anti-TGF-β d, e; 2 technical replicates per concentration; representative of 3 independent experiments. Analysis by multiple t tests showed no significant difference in responses to TGM when anti-TGF-β was present, but signicant effects (p < 0.01) on responses to all concentrations of TGF-β. f, g Magnetically sorted murine CD4+ T cells were cultured for 5 days with Th17-promoting ligands (100 ng/ml IL-6, 5 ng/ml IL-23, 10 ug anti-IFN-γ), together with the indicated concentrations of Hp-TGM or TGF-β, then stimulated with PMA/ionomycin in the presence of Brefeldin A for 4.5 h before staining for intracellular Foxp3 and IL-17. Data are mean ± SEM of triplicate replicates from 1 of 2 independent experiments; data were analysed by multiple t tests which showed no significant difference at any concentration of TGF-β v TGM for percentage IL-17+, and p < 0.001 and p < 0.01, respectively for 10 and 50 ng/ml TGM v TGF-β for percentage Foxp3+. Gating strategy is shown in Supplementary Fig. 6. h, i Murine CD4+ T cells were cultured as above with but with Th9-promoting ligands (40 ng/ml IL-4, 20 ng/ml IL-2), and assayed as above after 4 days of culture by staining for intracellular Foxp3 and IL-9. Data are mean ± SEM of three replicates from 1 of 2 independent experiments; data were analysed by multiple t tests which showed p < 0.05 for 1 ng/ml TGF-β v TGM for percentage IL-9+, and p < 0.001 for 10, 50, and 100 ng/ml TGM v TGF-β for percentage Foxp3+. Gating strategy is shown in Supplementary Fig. 6
Fig. 5
Fig. 5
Hp-TGM induces Foxp3 expression in human T cells. ac Human peripheral blood mononuclear cells were separated from red blood cells over a Ficoll gradient and CD4+ T cells isolated by MACS positive selection. Isolated cells were cultured at 37 °C for 96 h with a 1:1 ratio of CD3/CD28 Dynabeads® and variable concentrations of hTGF-β1 or Hp-TGM. Induction of Tregs from human peripheral blood monuclear cells. Data are means and SEM from two technical replicates per concentration and representative of 2 independent experiments, analysed by unpaired t test and corrected for multiple comparisons; *p < 0.05. Gating strategy is shown in Supplementary Fig. 6. a Representative flow cytometry plots (CD4+ population shown) of MACS-purified CD4+ positive selected PBMCs stimulated with Hp-TGM, hTGF-β or IL-2 respectively; b Percentage of CD25+Foxp3+ cells among total CD4+ cells; c MFI of Foxp3 among Foxp3+ cells
Fig. 6
Fig. 6
Hp-TGM drives immune regulation in vitro and in vivo. a Mouse Foxp3+ Treg cells are suppressive in vitro. CD4+CD25+GFP+ cells, generated as Fig. 4a were isolated by FACS and co-cultured with CD4+CD25GFP responder cells from Foxp3-GFP mice together with, irradiated APCs and anti-CD3 for 5 days. Proliferation was assessed by thymidine incorporation, and percentage suppression calculated; data are means ± SEM from 3 replicates per concentration and represent two independent experiments. b Hp-TGM prolongs survival of fully allogeneic full-thickness BALB/c to C57BL/6 skin grafts. Kaplan–Meier curve of graft survival: allograft only (n = 6), allograft + HES or Hp-TGM following implantation of intraperitoneal minipumps, n = 6) and syngeneic controls, n = 3. Mantel-Cox comparison of allograft vs. allograft + Hp-TGM survival curves: p = 0.0136. c, d Histological analyses of graft sites 7 days following transplantation; c, representative images of tissues sections, scale bars = 100 µm; d, scoring of inflammation on 3 sections per graft performed in a blinded fashion: syngeneic control (n = 7), allograft + control protein (n = 14), allograft + HES (n = 13), allograft + TGM (n = 12); data shown combine two independent experiments, with mean ± SEM shown. HES vs untreated allogeneic control p = 0.0493; Hp-TGM v untreated control p = 0.0397, by unpaired t test. e, f Treg and Th17 CD4+ T cell populations 21 days after transplantation, in e draining lymph node Foxp3+ (syngeneic controls (n = 3), allograft + control protein (n = 6), allograft + TGM minipump (n = 6); two-tailed, unpaired t test: p = 0.0042) and f spleen RORγt+ (syngeneic controls (n = 3), allograft + control protein (n = 7), allograft + TGM minipump (n = 6); two-tailed, unpaired t test: p = 0.0112). Gating strategy is shown in Supplementary Fig. 6. g, h Fibrogenesis in human lung fibroblasts exposed to TGFβ1 or Hp-TGM, assayed by immunofluoresence for collagen deposition (g, see Supplementary Fig. 8A for quantitative summary) and smooth muscle actin (h, presented as quantitative summary, see Supplementary Fig. 8B for fluorescence micrographs). Human collagen I stained with AF488-conjugated scondary antibody (green) and counterstained with DAPI (blue). Scale bars = 200 µm. Data are means ± SEM from 1 of 3 replicate experiments, with 4 technical replicates per group

Similar articles

Cited by

References

    1. Maizels RM, Yazdanbakhsh M. Regulation of the immune response by helminth parasites: cellular and molecular mechanisms. Nat. Rev. Immunol. 2003;3:733–743. doi: 10.1038/nri1183. - DOI - PubMed
    1. Elliott DE, Summers RW, Weinstock JV. Helminths as governors of immune-mediated inflammation. Int. J. Parasitol. 2007;37:457–464. doi: 10.1016/j.ijpara.2006.12.009. - DOI - PubMed
    1. McSorley HJ, Maizels RM. Helminth infections and host immune regulation. Clin. Micro Rev. 2012;25:585–608. doi: 10.1128/CMR.05040-11. - DOI - PMC - PubMed
    1. Taylor M, et al. Removal of regulatory T cell activity reverses hyporesponsiveness and leads to filarial parasite clearance in vivo. J. Immunol. 2005;174:4924–4933. doi: 10.4049/jimmunol.174.8.4924. - DOI - PubMed
    1. Blankenhaus B, et al. Strongyloides ratti infection induces expansion of Foxp3+ regulatory T cells that interfere with immune response and parasite clearance in BALB/c mice. J. Immunol. 2011;186:4295–4305. doi: 10.4049/jimmunol.1001920. - DOI - PubMed

Publication types

MeSH terms

Substances