

Autophagy regulates cisplatin-induced stemness and chemoresistance via the upregulation of CD44, ABCB1 and ADAM17 in oral squamous cell carcinoma
- PMID: 29171106
- PMCID: PMC6528880
- DOI: 10.1111/cpr.12411
Autophagy regulates cisplatin-induced stemness and chemoresistance via the upregulation of CD44, ABCB1 and ADAM17 in oral squamous cell carcinoma
Abstract
Objective: We inspected the relevance of CD44, ABCB1 and ADAM17 in OSCC stemness and deciphered the role of autophagy/mitophagy in regulating stemness and chemoresistance.
Material and methods: A retrospective analysis of CD44, ABCB1 and ADAM17 with respect to the various clinico-pathological factors and their correlation was analysed in sixty OSCC samples. Furthermore, the stemness and chemoresistance were studied in resistant oral cancer cells using sphere formation assay, flow cytometry and florescence microscopy. The role of autophagy/mitophagy was investigated by transient transfection of siATG14, GFP-LC3, tF-LC3, mKeima-Red-Mito7 and Western blot analysis of autophagic and mitochondrial proteins.
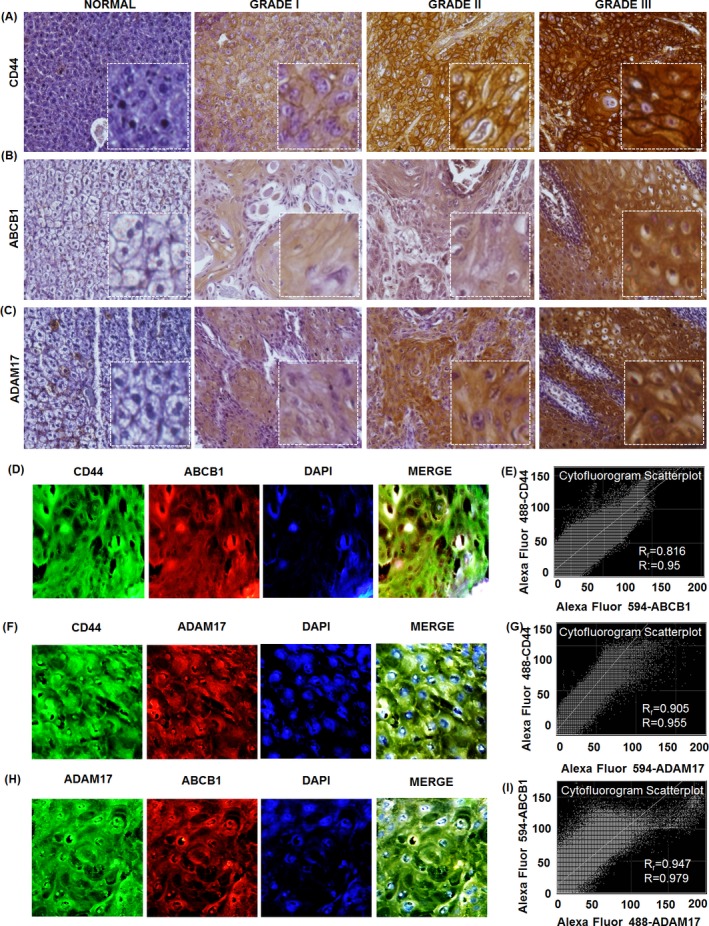
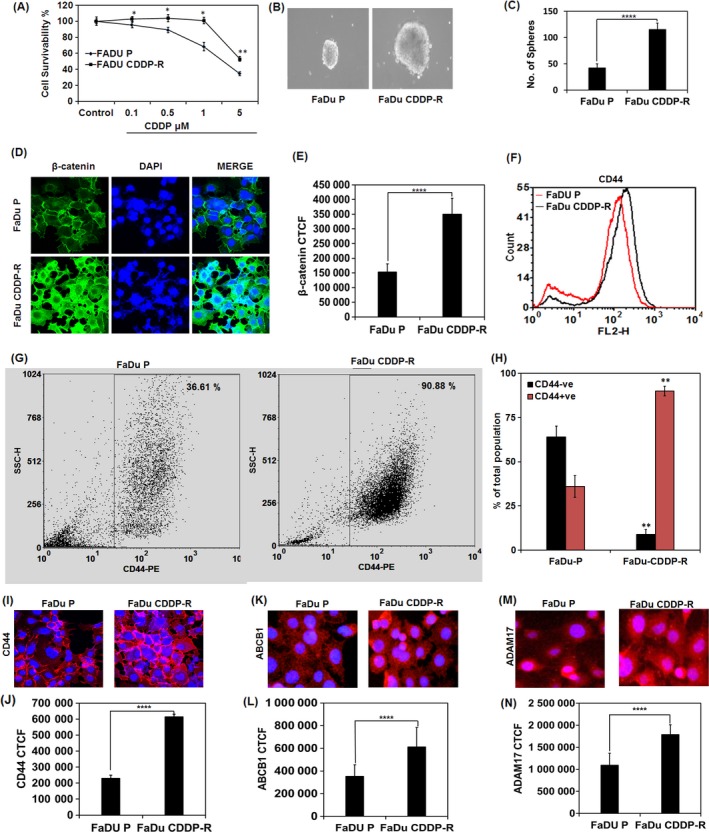
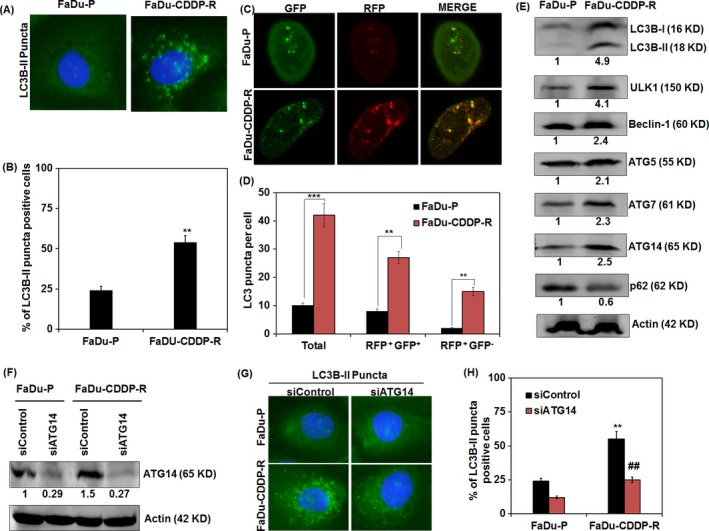
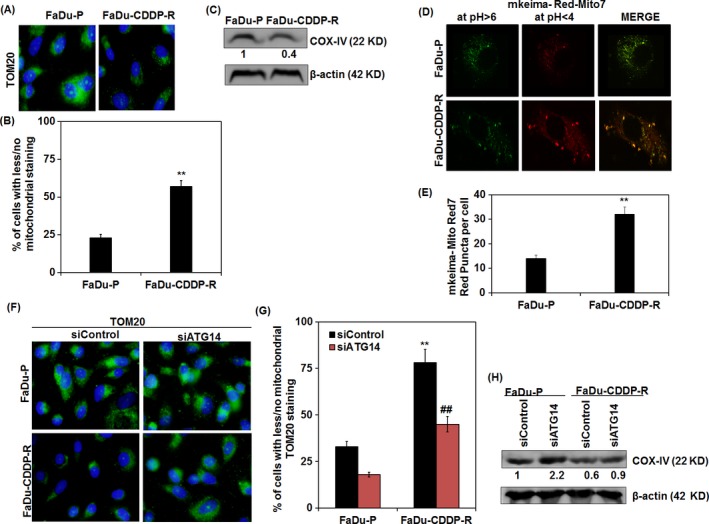
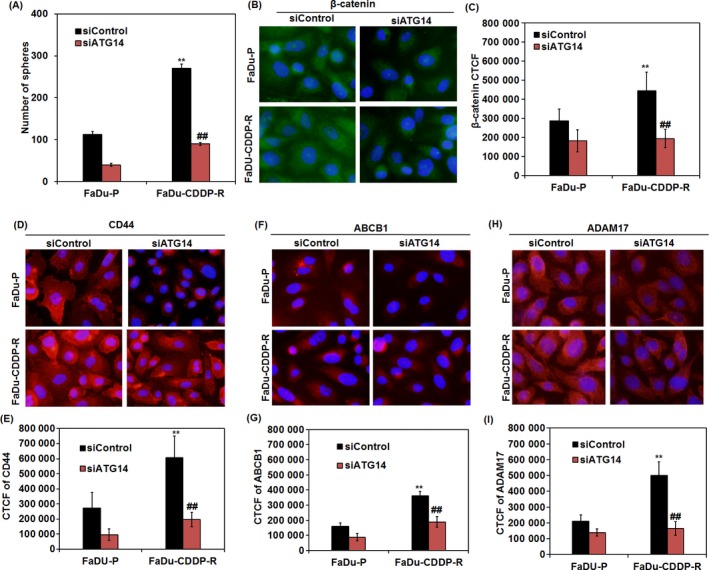
Results: In OSCC, high CD44, ABCB1 and ADAM17 expressions were correlated with higher tumour grades and poor differentiation and show significant correlation in their co-expression. In vitro and OSCC tissue double labelling confirmed that CD44+ cells co-expresses ABCB1 and ADAM17. Further, cisplatin (CDDP)-resistant FaDu cells displayed stem-like features and higher CD44, ABCB1 and ADAM17 expression. Higher autophagic flux and mitophagy were observed in resistant FaDu cells as compared to parental cells, and inhibition of autophagy led to the decrease in stemness, restoration of mitochondrial proteins and reduced expression of CD44, ABCB1 and ADAM17.
Conclusion: The CD44+ /ABCB1+ /ADAM17+ expression in OSCC is associated with stemness and chemoresistance. Further, this study highlights the involvement of mitophagy in chemoresistance and autophagic regulation of stemness in OSCC.
Keywords: ABCB1; ADAM17; CD44; autophagy; chemoresistance; stemness.
© 2017 John Wiley & Sons Ltd.
Conflict of interest statement
The authors disclose no conflict of interest.
Figures
Similar articles
-
Crosstalk between Raf-MEK-ERK and PI3K-Akt-GSK3β signaling networks promotes chemoresistance, invasion/migration and stemness via expression of CD44 variants (v4 and v6) in oral cancer.Oral Oncol. 2018 Nov;86:234-243. doi: 10.1016/j.oraloncology.2018.09.028. Epub 2018 Oct 4. Oral Oncol. 2018. PMID: 30409306
-
Acquisition cancer stemness, mesenchymal transdifferentiation, and chemoresistance properties by chronic exposure of oral epithelial cells to arecoline.Oncotarget. 2016 Dec 20;7(51):84072-84081. doi: 10.18632/oncotarget.11432. Oncotarget. 2016. PMID: 27557511 Free PMC article.
-
ADAM17-mediated CD44 cleavage promotes orasphere formation or stemness and tumorigenesis in HNSCC.Cancer Med. 2013 Dec;2(6):793-802. doi: 10.1002/cam4.147. Epub 2013 Oct 16. Cancer Med. 2013. PMID: 24403253 Free PMC article.
-
The role of CD44 in cancer chemoresistance: A concise review.Eur J Pharmacol. 2021 Jul 15;903:174147. doi: 10.1016/j.ejphar.2021.174147. Epub 2021 May 5. Eur J Pharmacol. 2021. PMID: 33961871 Review.
-
The two faces of autophagy in oral squamous cell carcinoma.Arch Oral Biol. 2022 Feb;134:105321. doi: 10.1016/j.archoralbio.2021.105321. Epub 2021 Dec 6. Arch Oral Biol. 2022. PMID: 34923284 Review.
Cited by
-
Autophagy of macrophages is regulated by PI3k/Akt/mTOR signalling in the development of diabetic encephalopathy.Aging (Albany NY). 2018 Oct 22;10(10):2772-2782. doi: 10.18632/aging.101586. Aging (Albany NY). 2018. PMID: 30346929 Free PMC article.
-
CLU (clusterin) promotes mitophagic degradation of MSX2 through an AKT-DNM1L/Drp1 axis to maintain SOX2-mediated stemness in oral cancer stem cells.Autophagy. 2023 Aug;19(8):2196-2216. doi: 10.1080/15548627.2023.2178876. Epub 2023 Mar 6. Autophagy. 2023. PMID: 36779631 Free PMC article.
-
Teaching an old dog new tricks: reactivated developmental signaling pathways regulate ABCB1 and chemoresistance in cancer.Cancer Drug Resist. 2021 Jun 19;4(2):424-452. doi: 10.20517/cdr.2020.114. eCollection 2021. Cancer Drug Resist. 2021. PMID: 35582031 Free PMC article. Review.
-
Roles of Mitochondria in Oral Squamous Cell Carcinoma Therapy: Friend or Foe?Cancers (Basel). 2022 Nov 22;14(23):5723. doi: 10.3390/cancers14235723. Cancers (Basel). 2022. PMID: 36497206 Free PMC article. Review.
-
Cancer stem cell fate determination: mito-nuclear communication.Cell Commun Signal. 2023 Jun 27;21(1):159. doi: 10.1186/s12964-023-01160-x. Cell Commun Signal. 2023. PMID: 37370081 Free PMC article. Review.
References
-
- Costea D, Tsinkalovsky O, Vintermyr O, Johannessen A, Mackenzie I. Cancer stem cells—new and potentially important targets for the therapy of oral squamous cell carcinoma. Oral Dis. 2006;12:443‐454. - PubMed
-
- Naik PP, Das DN, Panda PK, et al. Implications of cancer stem cells in developing therapeutic resistance in oral cancer. Oral Oncol. 2016;62:122‐135. - PubMed
-
- Dikic I, Johansen T, Kirkin V. Selective autophagy in cancer development and therapy. Cancer Res. 2010;70:3431‐3434. - PubMed
MeSH terms
Substances
LinkOut - more resources
Full Text Sources
Other Literature Sources
Medical
Miscellaneous
