

Optimization and validation of automated hippocampal subfield segmentation across the lifespan
- PMID: 29171108
- PMCID: PMC5861710
- DOI: 10.1002/hbm.23891
Optimization and validation of automated hippocampal subfield segmentation across the lifespan
Abstract
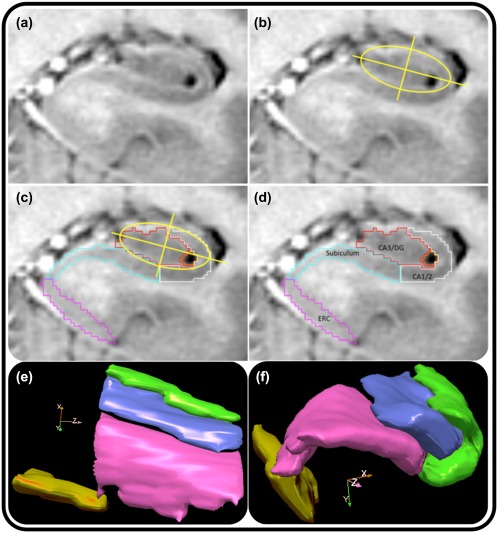
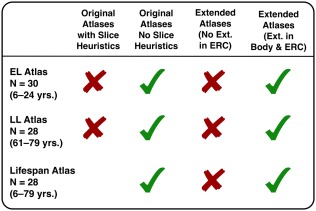
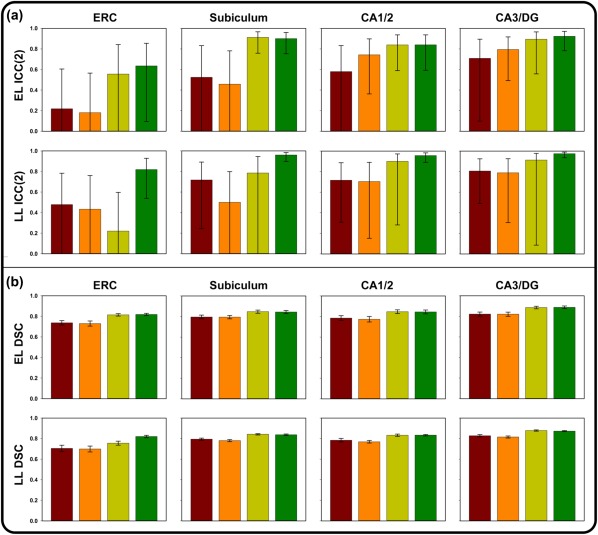
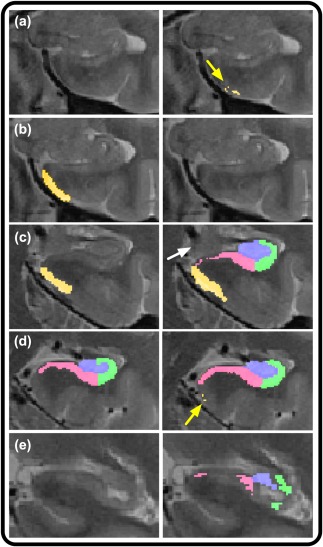
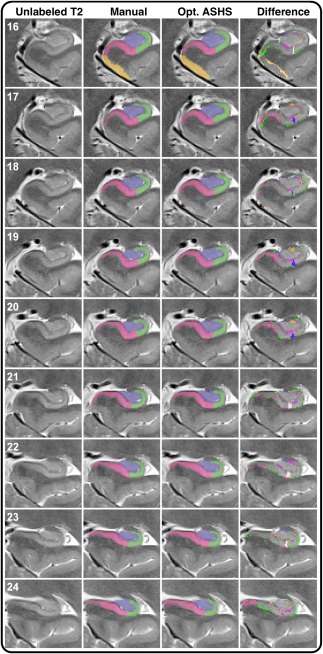
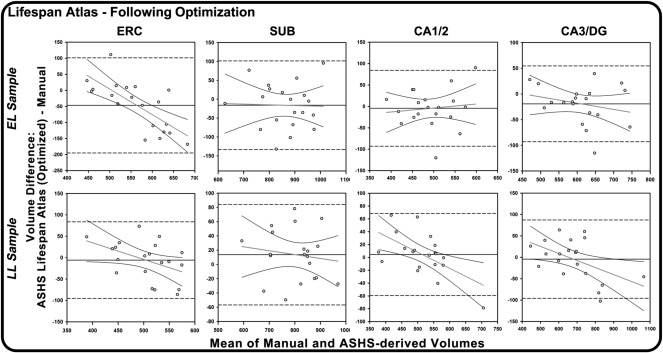
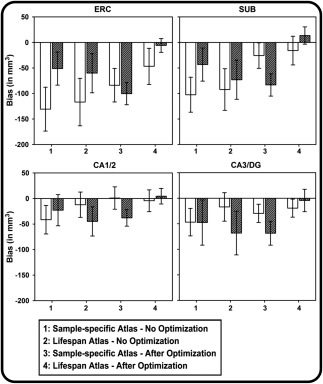
Automated segmentation of hippocampal (HC) subfields from magnetic resonance imaging (MRI) is gaining popularity, but automated procedures that afford high speed and reproducibility have yet to be extensively validated against the standard, manual morphometry. We evaluated the concurrent validity of an automated method for hippocampal subfields segmentation (automated segmentation of hippocampal subfields, ASHS; Yushkevich et al., ) using a customized atlas of the HC body, with manual morphometry as a standard. We built a series of customized atlases comprising the entorhinal cortex (ERC) and subfields of the HC body from manually segmented images, and evaluated the correspondence of automated segmentations with manual morphometry. In samples with age ranges of 6-24 and 62-79 years, 20 participants each, we obtained validity coefficients (intraclass correlations, ICC) and spatial overlap measures (dice similarity coefficient) that varied substantially across subfields. Anterior and posterior HC body evidenced the greatest discrepancies between automated and manual segmentations. Adding anterior and posterior slices for atlas creation and truncating automated output to the ranges manually defined by multiple neuroanatomical landmarks substantially improved the validity of automated segmentation, yielding ICC above 0.90 for all subfields and alleviating systematic bias. We cross-validated the developed atlas on an independent sample of 30 healthy adults (age 31-84) and obtained good to excellent agreement: ICC (2) = 0.70-0.92. Thus, with described customization steps implemented by experts trained in MRI neuroanatomy, ASHS shows excellent concurrent validity, and can become a promising method for studying age-related changes in HC subfield volumes.
Keywords: MRI; aging; development; hippocampus; morphometry; validation; volume.
© 2017 Wiley Periodicals, Inc.
Figures
Similar articles
-
Multi-atlas segmentation of the whole hippocampus and subfields using multiple automatically generated templates.Neuroimage. 2014 Nov 1;101:494-512. doi: 10.1016/j.neuroimage.2014.04.054. Epub 2014 Apr 29. Neuroimage. 2014. PMID: 24784800
-
Automated Hippocampal Subfield Segmentation at 7T MRI.AJNR Am J Neuroradiol. 2016 Jun;37(6):1050-7. doi: 10.3174/ajnr.A4659. Epub 2016 Feb 4. AJNR Am J Neuroradiol. 2016. PMID: 26846925 Free PMC article.
-
Accuracy and bias of automatic hippocampal segmentation in children and adolescents.Brain Struct Funct. 2019 Mar;224(2):795-810. doi: 10.1007/s00429-018-1802-2. Epub 2018 Dec 3. Brain Struct Funct. 2019. PMID: 30511334
-
Hippocampal subfields at ultra high field MRI: An overview of segmentation and measurement methods.Hippocampus. 2017 May;27(5):481-494. doi: 10.1002/hipo.22717. Epub 2017 Feb 23. Hippocampus. 2017. PMID: 28188659 Free PMC article. Review.
-
FreeSurfer-based segmentation of hippocampal subfields: A review of methods and applications, with a novel quality control procedure for ENIGMA studies and other collaborative efforts.Hum Brain Mapp. 2022 Jan;43(1):207-233. doi: 10.1002/hbm.25326. Epub 2020 Dec 27. Hum Brain Mapp. 2022. PMID: 33368865 Free PMC article. Review.
Cited by
-
Multi-Night Electroencephalography Reveals Positive Association Between Sleep Efficiency and Hippocampal Subfield and Entorhinal Cortex Volumes in Healthy Aging.Hum Brain Mapp. 2024 Dec 15;45(18):e70090. doi: 10.1002/hbm.70090. Hum Brain Mapp. 2024. PMID: 39720895 Free PMC article.
-
Hair cortisol concentrations are associated with hippocampal subregional volumes in children.Sci Rep. 2020 Mar 17;10(1):4865. doi: 10.1038/s41598-020-61131-x. Sci Rep. 2020. PMID: 32184428 Free PMC article.
-
Daily biofeedback to modulate heart rate oscillations affects structural volume in hippocampal subregions targeted by the locus coeruleus in older adults but not younger adults.medRxiv [Preprint]. 2023 Sep 11:2023.03.02.23286715. doi: 10.1101/2023.03.02.23286715. medRxiv. 2023. Update in: Neurobiol Aging. 2023 Dec;132:85-99. doi: 10.1016/j.neurobiolaging.2023.08.010. PMID: 37745356 Free PMC article. Updated. Preprint.
-
A data integration method for new advances in development cognitive neuroscience.Dev Cogn Neurosci. 2024 Dec;70:101475. doi: 10.1016/j.dcn.2024.101475. Epub 2024 Nov 9. Dev Cogn Neurosci. 2024. PMID: 39549555 Free PMC article.
-
Hippocampal Subfields and Limbic White Matter Jointly Predict Learning Rate in Older Adults.Cereb Cortex. 2020 Apr 14;30(4):2465-2477. doi: 10.1093/cercor/bhz252. Cereb Cortex. 2020. PMID: 31800016 Free PMC article.
References
-
- Amaral, R. S. , Park, M. T. , Devenyi, G. A. , Lynn, V. , Pipitone, J. , Winterburn, J. , … Chakravarty, M. M. (2017). Manual segmentation of the fornix, fimbria, and alveus on high‐resolution 3T MRI: Application via fully‐automated mapping of the human memory circuit white and grey matter in healthy and pathological aging. NeuroImage. Available online Oct 18, 2016. - PubMed
-
- Bender, A. R. , Daugherty, A. M. , & Raz, N. (2013). Vascular risk moderates associations between hippocampal subfield volumes and memory. Journal of Cognitive Neuroscience, 25, 1851–1862. - PubMed
-
- Bertram, L. , Böckenhoff, A. , Demuth, I. , Düzel, S. , Eckardt, R. , Li, S. C. , … Steinhagen‐Thiessen, E. (2014). Cohort profile: The Berlin aging study II (BASE‐II). International Journal of Epidemiology, dyt018. - PubMed
-
- Bland, J. M. , & Altman, D. (1986). Statistical methods for assessing agreement between two methods of clinical measurement. Lancet, 327, 307–310. - PubMed
-
- Crocker, L. , & Algina, J. (1986). Introduction to classical and modern test theory. Orlando, FL: Holt, Rinehart and Winston.
Publication types
MeSH terms
Grants and funding
LinkOut - more resources
Full Text Sources
Other Literature Sources
Medical
