. 2018 Apr;34(4):e2946.
doi: 10.1002/cnm.2946. Epub 2018 Jan 18.

On computational fluid dynamics models for sinonasal drug transport: Relevance of nozzle subtraction and nasal vestibular dilation

Affiliations

On computational fluid dynamics models for sinonasal drug transport: Relevance of nozzle subtraction and nasal vestibular dilation

Saikat Basu et al. Int J Numer Method Biomed Eng. 2018 Apr.

Abstract

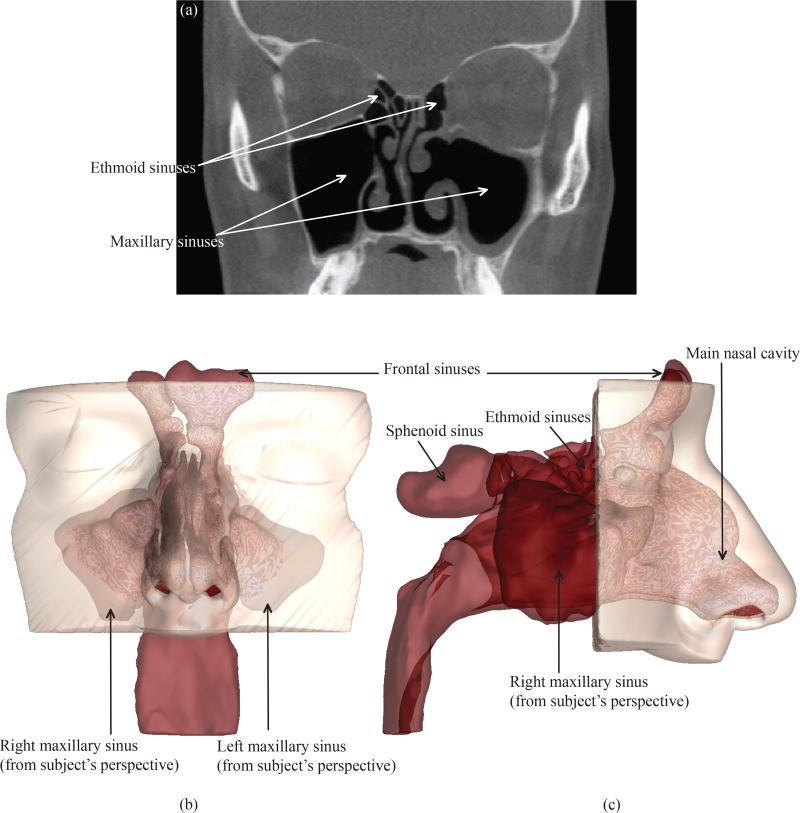
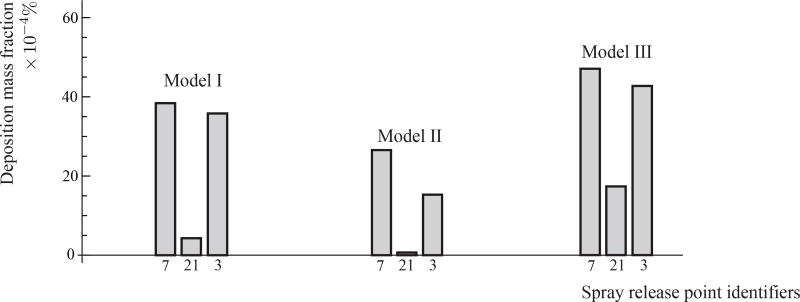
Generating anatomically realistic 3-dimensional (3D) models of the human sinonasal cavity for numerical investigations of sprayed drug transport presents a host of methodological ambiguities. For example, subject-specific radiographic images used for 3D reconstructions typically exclude spray bottles. Subtracting a bottle contour from the 3D airspace and dilating the anterior nasal vestibule for nozzle placement augment the complexity of model building. So we explored the question: how essential are these steps to adequately simulate nasal airflow and identify the optimal delivery conditions for intranasal sprays? In particular, we focused on particle deposition patterns in the maxillary sinus, a critical target site for chronic rhinosinusitis. The models were reconstructed from postsurgery computed tomography scans for a 39-year-old Caucasian male, with chronic rhinosinusitis history. Inspiratory airflow patterns during resting breathing are reliably tracked through computational fluid dynamics-based steady-state laminar-viscous modeling, and such regimes portray relative lack of sensitivity to inlet perturbations. Consequently, we hypothesized that the posterior airflow transport and the particle deposition trends should not be radically affected by the nozzle subtraction and vestibular dilation. The study involved 1 base model and 2 derived models; the latter 2 with nozzle contours (2 different orientations) subtracted from the dilated anterior segment of the left vestibule. We analyzed spray transport in the left maxillary sinus for multiple release conditions. Similar release points, localized on an approximately 2 mm × 4.5 mm contour, facilitated improved maxillary deposition in all 3 test cases. This suggests functional redundancy of nozzle insertion in a 3D numerical model for identifying the optimal spray release locations.

Keywords: chronic rhinosinusitis; clinical engineering; computational fluid dynamics (CFD); nasal sprays; sinonasal modeling; topical drug delivery.


Conflict of interest statement

CONFLICT OF INTEREST STATEMENT

The authors do not have any financial and personal relationships with other people or organization(s) that could inappropriately influence or bias their work. No conflict of interest exists in the submission of this manuscript, and the manuscript was approved by all the authors for publication. The work described is original research that has not been published previously, and not under consideration for publication elsewhere. All the authors were fully involved in the study and preparation of the manuscript.

Figures

Figure 1
Figure 1
(a) A representative CT imaging slice of the subject’s sinonasal cavity, after a bilateral functional endoscopic sinus surgery. The coronal section is at the level of mid maxillary sinus. Panel (b) depicts the coronal view and panel (c) presents the sagittal view of the anatomically realistic 3D reconstruction of the sinonasal cavity from the CT scans. The different sinonasal chambers are marked.
Figure 2
Figure 2
(a) Model I (base model) reconstructed from the CT scans. Panels (b) and (c) show the derived models (Model II and Model III, respectively). In (b) and (c), the red contours comprise the nozzle-subtracted airspace and represent two different nozzle orientations. Note that although the outer lining of the nozzle contour touched the nasal wall in Models II and III, still the nozzle tip remained in the internal cavity space in each case. Panel (d) demonstrates the real nozzle contour that was subtracted from the base model airspace to generate Models II and III.
Figure 3
Figure 3
Composite panel (a) shows localized mesh refinements in the maxillary sinuses. 5 cases were considered: 1.0X (base mesh comprising 4 million graded tetrahedral elements and three prism layers each of 0.1 mm thickness), 1.5X (with maxillary sinuses having 1.5 times the number of elements as in the base mesh maxillaries), 2.0X (with maxillary sinuses having twice the number of elements as in the base mesh maxillaries), 2.5X (with maxillary sinuses having 2.5 times the number of elements as in the base mesh maxillaries), and 3.0X (with maxillary sinuses having thrice the number of elements as in the base mesh maxillaries). Panel (b) shows the flow velocity profile across a horizontal line spanning the antrostomy opening for the left maxillary sinus. In the velocity profile diagram, the vertical axis plots the X component of flow velocity (uXa) at the antrostomy window, and the horizontal axis tracks the anterior-to-posterior distance δa along the line across the antrostomy opening. (c) The white line on the sinonasal base model (Model I) illustrates a representative cross-sectional cut. (d) Representative visual of the meshed model along the cut from panel (c). The mesh consists of four million unstructured, graded tetrahedral elements along with three layers of 0.1 mm prism cells extruded at the cavity-tissue interfaces. (e) Inset: A representative zoomed-in snapshot of the base mesh boundaries with the prism layers. Background color was inverted for better visualization. These figures were generated on the postprocessing software package FieldView™ 16 (Intelligent Light, Lyndhurst, PA).
Figure 4
Figure 4
Safe spray release points are extracted from Model I. The X axis points in the sagittal direction, the Z axis points in the coronal direction, and the Y axis points perpendicularly upward from the hard floor of the palate in the axial direction. Each individual spray release axis is directed from the centroid of the left nostril plane (marked by the tiny dark square) to the corresponding release point. Panels (a) and (b) show the release contour. Panel (c) demonstrates all 43 probable release points and directions. Panel (d) sagittally lays out the clinically inadvisable directions. The 27 clinically safe release conditions are in panel (e). To expedite identification of the optimal release zone, we devise a schematic segmentation of the release surface, displayed in the cartoon in panel (f). We delineate three zones (distal, middle, proximal) on each of the lateral and medial halves of the release surface. For the current release surface, the regional segmentation is shown in panel (g), along with the numeric labels of the release points, as assigned in Fluent™.
Figure 5
Figure 5
Lognormal distribution of the particulate droplet sizes in the Flonase™ spray for a single shot weight of 100 mg. The total number of particles in one shot, as per the particle size distribution (PSD) with 5 µm size bins, was estimated to be 343,968. The particles were all assumed to be spherical in shape and of unit density. WS represents one shot weight.
Figure 6
Figure 6
Representative streamlines from the numerical airflow simulations in: (a) Model I, (b) Model II, and (c) Model III. Panels (b) and (c) additionally demonstrate the nozzle placement, corresponding to the nozzle contours that have been subtracted (along with the inclusion of dilated nares) from the nasal airspace in the two derived models. The grey background shows the tissue domain lining the sinonasal cavity. Panels (d)–(f) overlay the LMS deposition spikes (colored black) on the spray release points (from Figure 4), with taller spikes signifying higher deposition. Particles moving through faster streamlines had better penetration into the nasal models, which in turn contributed to better LMS topical deposition. See §3 for details of the TSPD findings. These figures were generated using the postprocessing software package FieldView™, after import of the numerical solutions from Fluent™.
Figure 7
Figure 7
Bar diagram of the spray mass fractions deposited in the LMS for particles sprayed from the 27 clinically safe release points in the three test models. The numbers on the horizontal axis indicate the corresponding identifiers of the clinically safe spray release locations, based on their assigned nomenclature by Fluent™ and displayed in Figure 4. The bar heights have been proportionally standardized with the peak deposits in all three models being represented by equally tall bars, albeit with change of vertical unit scale to account for the quantitatively unequal peak deposits. Identical numbers in different models correspond to the same release location coordinates in space. The error bars represent the maximum and minimum deposits from the five particle tracking simulation runs implemented for each spray release point. Deposition data for the spray release points located in the lateral and medial halves of the vestibule has been demarcated by the dashed line. The grey bars indicate the release locations for which turbulence simulations were run (findings to be presented later in this manuscript) to compare with the quantity-based ordering of the LMS deposition data from the laminar simulations. Abbreviations: DL ≡ distal lateral, ML ≡ medial lateral, PL ≡ proximal lateral, DM ≡ distal medial, MM ≡ middle medial, PL ≡ proximal medial. Schematics in Figure 4(e) and (d) portray the physical positioning of these zones, obtained from regional segmentation of the spray release surface.
Figure 8
Figure 8
Panels (a), (b), and (c) show the topical deposition patterns at the LMS in Models I, II, and III respectively. The nasal vestibule is dilated in Models II and III, owing to the placement of the nozzle contour, thereby mimicking nozzle insertion effects in a real nose. The height of the red spike at each release point is proportional to the deposited mass fraction corresponding to that spray release location. The spike heights have been proportionally standardized with the peak deposits in the three test models being represented by equally tall spikes. Direction vectors of the spikes are oriented from the centroid of the nostril to the corresponding release point. The letter “S” marks the septal side of the nasal lining. Panel (d) shows the sectional cut through which the depictions in (a), (b), and (c) were visualized. The “bubble-diagrams” in panels (e), (f), and (g) show an alternate visual representation of the same information. Here the release contour has been projected on the XZ plane, roughly parallel to the floor of the hard palate. The bubble sizes are proportional to the LMS deposit corresponding to the release location whose projection is the center of that bubble. The color scheme was so chosen that the findings for the same release point have the same color, in all three models. Note the unsafe release points were marked by the tiny hollow circles. We identified a small optimal zone for the best-possible spray release points and the oval outline (drawn with the dashed line) roughly demarcated that zone. For scaled representation, its size is compared to the US quarter-dollar coin. Panel (h) presents the bubble diagram-styled LMS deposition results for Model I, with the particle release locations at the respective nozzle tips of the spray bottle contours inserted in Models II and III. Panels (i) and (j) demonstrate the LMS deposits for Models II and III respectively, when the particles are released from the tip of the nozzle inserted in the 3D reconstruction for each. When compared to the main data from panels (e)–(g), bubble diameters in panels (i) and (j) have comparable rank-orders with the same trend as the ones in panel (h). Note: Nozzle Tip 1 ≡ locational coordinate of the nozzle tip as observed for the spray bottle orientation in Model II, Nozzle Tip 2 ≡ locational coordinate of the nozzle tip for the spray bottle orientation in Model III.
Figure 9
Figure 9
Sample trajectories (colored black) of one representative 5-µm-sized particle and one representative 25-µm-sized particle in the three models, without any ambient airflow, namely in panels (a), (c), (e) and (g) (i), (k), and with inspiratory airflow passing through the models, namely in panels (b), (d), (f) and (h), (j), (k). The tiny red circles mark the locations where the inertial motion, contributed by the spray exit velocity, ceases (with deceleration primarily induced by the air drag and gravity), following which the particles either fall freely under gravity (downward acceleration g) in the no-airflow simulations or are transported via the convoluted paths of the fluid streamlines in the simulations with ambient airflow. Heavier particles penetrate deeper before the cessation of the inertial motion. In the presence of inspiratory airflow, the representative 5 µm particle escapes through the pharyngeal outlet, while the representative 25 µm particle gets deposited in the ethmoid sinus. The representative particles were all sprayed with an exit speed of 19.2 m/s from release location 5. Initial direction of the particles subtended 45° with both Y and Z axes, and was at 90° to the X axis.
Figure 10
Figure 10
Color maps of the velocity magnitude of the inspired airflow field across six different cross-sections (c/s-1 to c/s-6). See the top-most panel for the cross-sections selected. Left-right orientation of the graphics in each of the flow profile panels respectively corresponds to the left and right sides of the study subject. The flow patterns observed on c/s-1 noticeably demonstrate the fluctuations from nozzle placement (in Models II and III) in the anterior vestibule. Stagnation zones closely posterior to the nozzle tips are demarcated by the black circles. Flow profiles display increasing conformity at larger penetration depths.
Figure 11
Figure 11
Representative spray deposit fractions in the LMS, based on inspiratory airflow modeled using k-ω turbulence framework. The relative order of the TSPDs matched with the results presented earlier in Figure 7 obtained from laminar simulations.
Figure 12
Figure 12
Graphical representation of the power of the sample with respect to the sample size. The latter, in this case, is the number of numerical runs implemented for particle tracking corresponding to each release point. These representative power curves were traced out for the release location 1 in all the three test models.

References

    1. Fokkens WJ, Lund VJ, Mullol J, Bachert C, Alobid I, Baroody F, Cohen N, Cervin A, Douglas R, Gevaert P, et al. European position paper on rhinosinusitis and nasal polyps 2012. Rhinology. Supplement. 2012;(23):3. - PubMed
    1. Benninger MS, Ferguson BJ, Hadley JA, Hamilos DL, Jacobs M, Kennedy DW, Lanza DC, Marple BF, Osguthorpe JD, Stankiewicz JA, et al. Adult chronic rhinosinusitis: definitions, diagnosis, epidemiology, and pathophysiology. Otolaryngology-Head and Neck Surgery. 2003;129(3):S1–S32. - PubMed
    1. Rosenfeld RM, Andes D, Bhattacharyya N, Cheung D, Eisenberg S, Ganiats TG, Gelzer A, Hamilos D, Haydon RC, Hudgins PA, et al. Clinical practice guideline: adult sinusitis. Otolaryngology-Head and Neck Surgery. 2007;137(3):S1–S31. - PubMed
    1. Albu S, Baciut M. Failures in endoscopic surgery of the maxillary sinus. Otolaryngology—Head and Neck Surgery. 2010;142(2):196–201. - PubMed
    1. Frank DO, Kimbell JS, Pawar S, Rhee JS. Effects of anatomy and particle size on nasal sprays and nebulizers. Otolaryngology–Head and Neck Surgery. 2012;146(2):313–319. - PMC - PubMed

Publication types

LinkOut - more resources