. 2017 Dec 12;9(6):2005-2017.
doi: 10.1016/j.stemcr.2017.10.025. Epub 2017 Nov 22.

Mode of Surgical Injury Influences the Source of Urothelial Progenitors during Bladder Defect Repair

Affiliations

Mode of Surgical Injury Influences the Source of Urothelial Progenitors during Bladder Defect Repair

Frank-Mattias Schäfer et al. Stem Cell Reports. .

Abstract

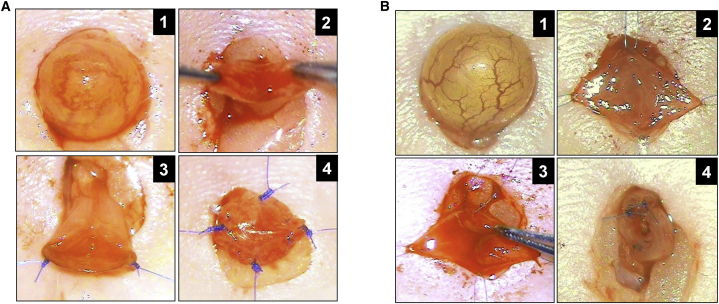
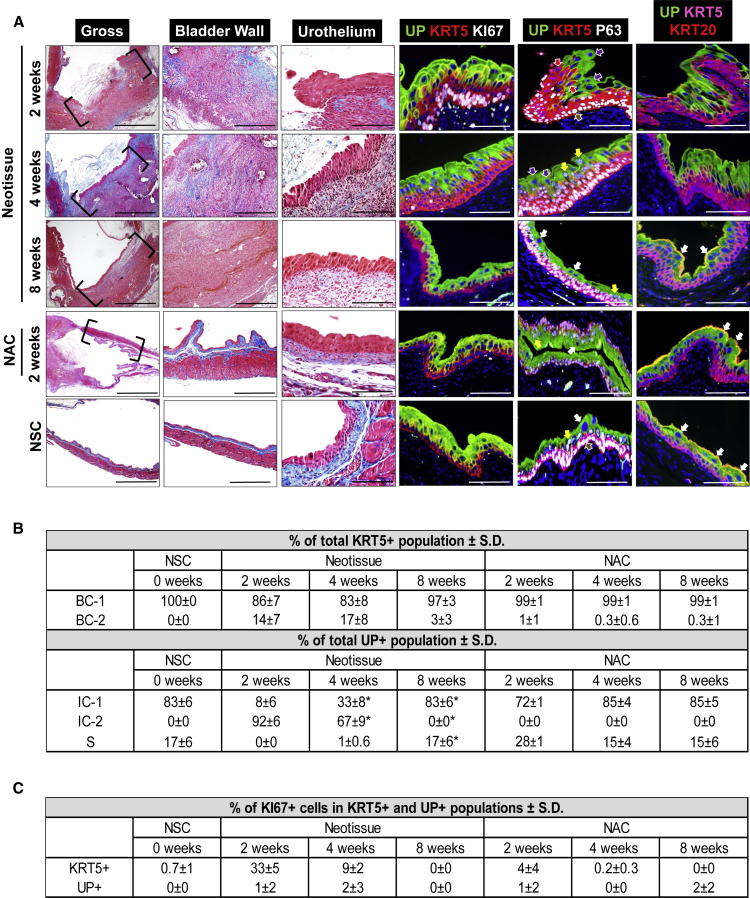
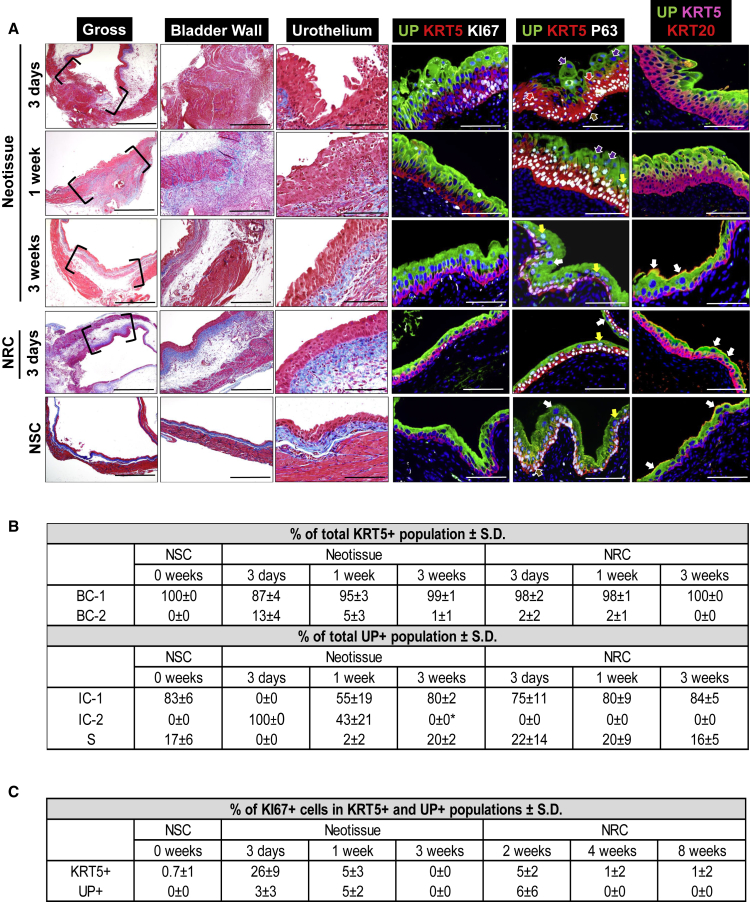
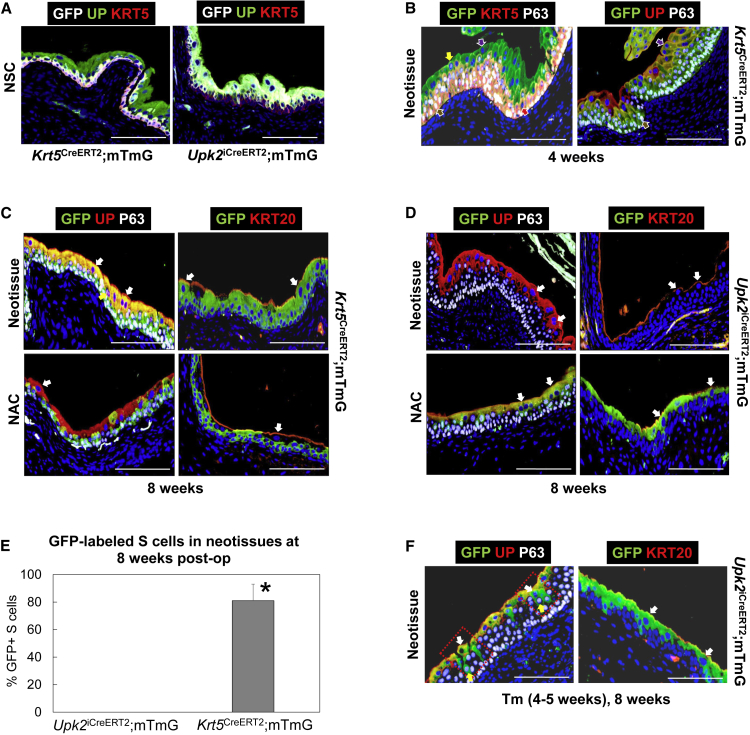
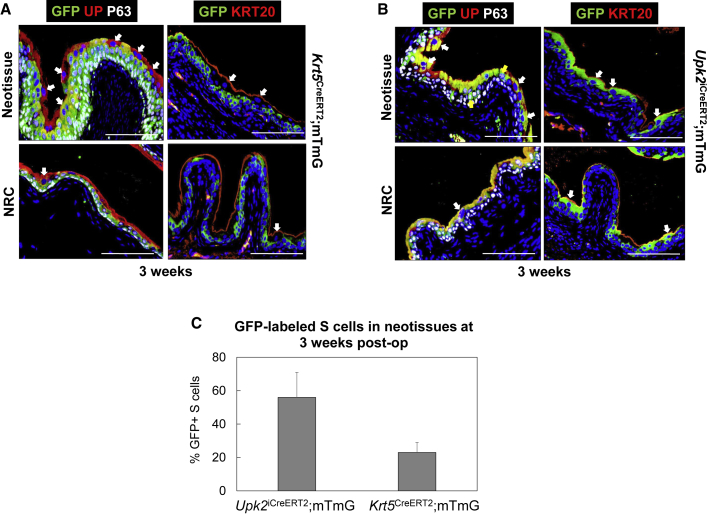
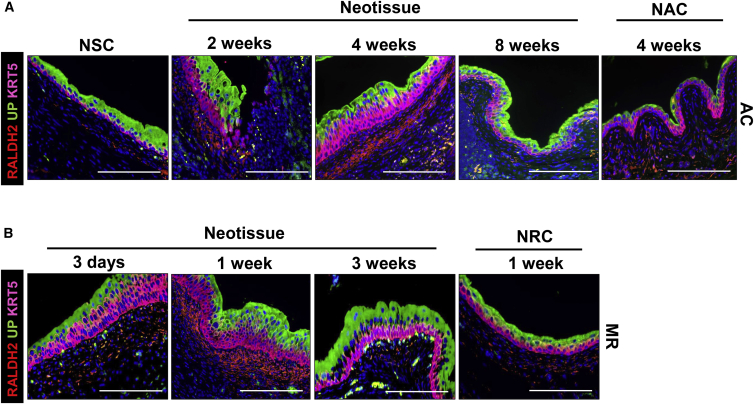
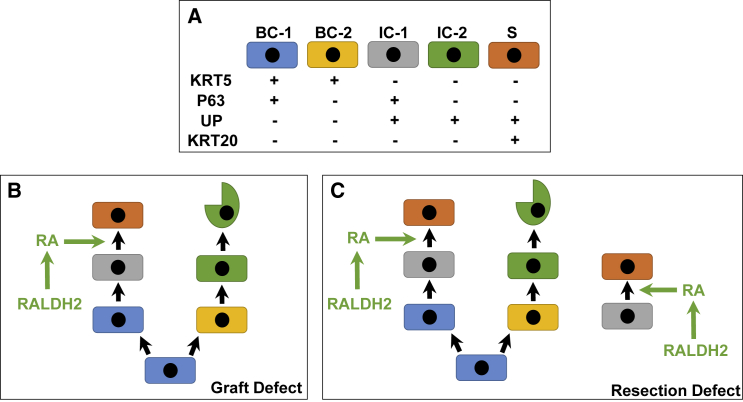
The bladder urothelium functions as a urine-blood barrier and consists of basal, intermediate, and superficial cell populations. Reconstructive procedures such as augmentation cystoplasty and focal mucosal resection involve localized surgical damage to the bladder wall whereby focal segments of the urothelium and underlying submucosa are respectively removed or replaced and regeneration ensues. We demonstrate using lineage-tracing systems that urothelial regeneration following augmentation cystoplasty with acellular grafts exclusively depends on host keratin 5-expressing basal cells to repopulate all lineages of the de novo urothelium at implant sites. Conversely, repair of focal mucosal defects not only employs this mechanism, but in parallel host intermediate cell daughters expressing uroplakin 2 give rise to themselves and are also contributors to superficial cells in neotissues. These results highlight the diversity of urothelial regenerative responses to surgical injury and may lead to advancements in bladder tissue engineering approaches.

Keywords: bladder; progenitor; tissue engineering; urothelium.


Figures

Figure 1
Figure 1
Surgical Bladder Injury Models in Mice (A) Augmentation cystoplasty with SIS graft. Panel 1: exposure of bladder prior to scaffold implantation. Panel 2: cystotomy and exposure of bladder lumen. Panels 3 and 4: anastomosis of graft into bladder defect and placement of marking sutures. (B) Focal resection of bladder mucosa. Panel 1: bladder exposure prior to surgical injury. Panel 2: midline incision of bladder wall. Panel 3: resection of bladder mucosa from one hemisphere of the bladder. Panel 4: bladder closure and integration of marking sutures at defect site perimeter. See also Figure S1.
Figure 2
Figure 2
Stages of Urothelial Regeneration at SIS Scaffold Implantation Sites (A) Column 1: MTS-stained gross bladder cross-sections from WT mice containing original SIS implant sites or nonaugmented control (NAC) regions (bracketed) following 2, 4, and 8 weeks post-op. Nonsurgical controls (NSC) analyzed in parallel. Column 2: magnification of bladder wall in implant or NAC regions bracketed in column 1 as well as parallel NSC. Column 3: magnification of urothelium in neotissues and NAC regions bracketed in column 1 as well as parallel regions of NSC. Columns 4–6: representative photomicrographs of tissues described in column 3 and subjected to IHC analyses for uroplakin (UP) 3A, KRT5, KI67, P63, or KRT20 protein expression. For all photomicrographs in, respective marker expression is displayed in red, green, or pink (Cy3, FITC, Cy5 labeling), and blue denotes DAPI nuclear counterstain. In columns 3 and 4, Cy5 labeling was false colored to white. Brown arrows denote BC-1 cells (KRT5+P63+UPKRT20), red arrows denote BC-2 cells (KRT5+P63UPKRT20), yellow arrows denote IC-1 cells (KRT5-P63+UP+KRT20), purple arrows denote IC-2 cells (KRT5P63UP+KRT20), and white arrows denote S cells (KRT5P63UP+KRT20+). Scale bars represent 1 mm (column 1), 500 μm (column 2), and 200 μm (columns 3–6). (B) Histomorphometric evaluations of urothelial subpopulations in NSC as well as neotissues and corresponding NAC regions following 2, 4, and 8 weeks post-op. Means ± SD. p < 0.05 in comparison with respective 2-week time point as determined by Wilcoxon signed-rank test. (C) Histomorphometric evaluations of Ki67+ cells in specimens described in (B). Means ± SD. Data in all panels were acquired from n = 3–4 animals per experimental group with n = 3 sections per animal analyzed for neotissue, NAC, and NSC evaluations.
Figure 3
Figure 3
Phases of Urothelial Regeneration at Regions of Focal Mucosal Resection (A) Column 1: MTS-stained gross bladder cross-sections from WT mice containing mucosal defect sites or nonresected control (NRC) regions (bracketed) following 3 days, 1 week, and 3 weeks post-op. Nonsurgical controls (NSC) analyzed in parallel. Column 2: magnification of bladder wall in implant or NRC regions bracketed in column 1 as well as parallel NSC. Column 3: magnification of urothelium in neotissues and NRC regions bracketed in column 1 as well as parallel regions of NSC. Columns 4–6: representative photomicrographs of tissues described in column 3 and subjected to IHC analyses for uroplakin (UP) 3A, KRT5, KI67, P63, or KRT20 protein expression. For all photomicrographs, respective marker expression is displayed in red, green, or pink (Cy3, FITC, Cy5 labeling), and blue denotes DAPI nuclear counterstain. In columns 3 and 4, Cy5 labeling was false colored to white. Brown arrows denote BC-1 cells (KRT5+P63+UPKRT20), red arrows denote BC-2 cells (KRT5+P63UPKRT20), yellow arrows denote IC-1 cells (KRT5P63+UP+KRT20), purple arrows denote IC-2 cells (KRT5P63UP+KRT20), and white arrows denote S cells (KRT5P63UP+KRT20+). Scale bars represent 1 mm (column 1), 500 μm (column 2), and 200 μm (columns 3–6). (B) Histomorphometric evaluations of urothelial subpopulations in NSC as well as neotissues and corresponding NRC regions following 3 days, 1 week, and 3 weeks post-op. Means ± SD. p < 0.05 in comparison with respective 3-day time point as determined by Wilcoxon signed-rank test. (C) Histomorphometric evaluations of Ki67+ cells in specimens described in (B). Means ± SD. Data in all panels were acquired from n = 3 animals per experimental group with n = 3 sections per animal analyzed for neotissue, NRC, and NSC evaluations. See also Figure S1.
Figure 4
Figure 4
Fate-Mapping Analyses of Urothelial Subpopulations during Regeneration of SIS Graft Sites (A) Bladder sections from Krt5CreERT2;mTmG and Upk2iCreERT2;mTmG nonsurgical control (NSC) mice following Tm induction, demonstrating restricted GFP expression in KRT5- and UP-positive cell layers, respectively. (B) SIS implant areas in Tm-induced Krt5CreERT2;mTmG mice at 4 weeks post-op, demonstrating GFP expression in de novo BC-1, BC-2, and IC-2 cell populations. (C) SIS graft sites and nonaugmented control (NAC) regions from Tm-induced Krt5CreERT2;mTmG mice at 8 weeks post-op demonstrating GFP expression in de novo BC-1, IC-1, and S cell populations in neotissues and GFP+ host BC-1 cells in NAC. (D) SIS graft sites and NAC regions in Upk2iCreERT2;mTmG mice at 8 weeks post-op showing no GFP expression in de novo urothelium in neotissues and GFP+ IC-1 and S cells in NAC. (E) Quantitation of GFP+ S cells in neotissues present in augmented bladders of Tm-induced Krt5CreERT2;mTmG and Upk2iCreERT2;mTmG mice following 8 weeks post-op. Means ± SD. p < 0.05 in comparison with Upk2iCreERT2;mTmG group as determined by Wilcoxon signed-rank test. (F) SIS graft regions in Upk2iCreERT2;mTmG mice at 8 weeks post-op, which were induced by Tm between weeks 4 and 5 following bladder augmentation. De novo urothelium demonstrated GFP expression in IC-1 and S cells. Boxed regions demonstrate dividing IC-1 cells giving rise to S cells. For (A)–(D) and (F), respective marker expression following IHC evaluations is displayed in red, green, or pink (Cy3, FITC, Cy5 labeling), and blue denotes DAPI nuclear counterstain. In some cases, Cy5 labeling was false colored to white. Brown arrows denote BC-1 cells (KRT5+P63+UPKRT20), red arrows denote BC-2 cells (KRT5+P63UPKRT20), yellow arrows denote IC-1 cells (KRT5P63+UP+KRT20), purple arrows denote IC-2 cells (KRT5P63UP+KRT20), and white arrows denote S cells (KRT5P63UP+KRT20+). For all panels, data were acquired from n = 3–4 animals per experimental group with n = 3 sections per animal analyzed for neotissue, NAC, NSC evaluations. Scale bars represent 200 μm (A–D and F).
Figure 5
Figure 5
Lineage-Tracing Analyses of Urothelial Subpopulations during Regeneration Focal Mucosal Defects (A) Sites of mucosal resection and NRC regions in Tm-induced Krt5CreERT2;mTmG mice at 3 weeks post-op revealing GFP expression in de novo BC-1, IC-1, and subsets of S cells in neotissues as well as GFP+ host BC-1 cells in NRC. (B) Sites of mucosal resection and NRC areas in Tm-induced Upk2iCreERT2;mTmG mice at 3 weeks post-op revealing GFP expression in de novo IC-1, and S cell fractions in neotissues as well as GFP+ host IC-1 and S in NRC. (C) Quantitation of GFP+ S cells in neotissues present in resected bladders of Tm-induced Krt5CreERT2;mTmG and Upk2iCreERT2;mTmG mice following 3 weeks post-op. Means ± SD. For (A) and (B), respective marker expression following IHC evaluations is displayed in red, green, or pink (Cy3, FITC, Cy5 labeling), and blue denotes DAPI nuclear counterstain. In some cases, Cy5 labeling was false colored to white. Yellow arrows denote IC-1 cells (KRT5P63+UP+KRT20) and white arrows denote S cells (KRT5P63UP+KRT20+). For all panels, data were acquired from n = 3 animals per experimental group with n = 3 sections per animal analyzed for neotissue and NRC evaluations. Scale bars represent 200 μm (A and B).
Figure 6
Figure 6
RALDH2 Expression Profiles in Regenerating Neotissues following Augmentation Cystoplasty and Focal Mucosal Resection (A) IHC evaluations of RALDH2, UP, and KRT5 expression in nonsurgical controls (NSC), SIS graft regions following 2, 4, and 8 weeks post-op, and NAC regions at 4 weeks post repair. (B) Parallel analysis of markers detailed in (A) during remodeling of mucosal defect sites at 3 days, 1 week, and 3 weeks following injury as well as NRC regions at 1 week post-op. Peak RALDH2 expression is detected in the suburothelial mesenchyme at 1 and 4 weeks following mucosal resection and bladder augmentation, respectively. For all panels, respective marker expression is displayed in red, green, or pink (Cy3, FITC, Cy5 labeling), and blue denotes DAPI nuclear counterstain. AC, augmentation cystoplasty; MR, mucosal resection. Representative data from n = 3 NSC animals and n = 3–5 mice per time point for neotissues in AC and MR groups as well as NAC and NRC regions. Three sections were evaluated for each animal replicate per group. Scale bars represent 200 μm.
Figure 7
Figure 7
Model of Urothelial Lineage Hierarchy and RA Signaling during Regeneration of Surgical Defects (A) Urothelial subpopulations and associated markers in normal and regenerating tissues. (B) Following augmentation cystoplasty, host BC-1 cells proliferate at defect sites and at early stages of defect repair give rise to BC-2 cells. BC-2 cells then differentiate into IC-2 cells, which then undergo exfoliation. At latter phases of remodeling, BC-1 cells undergo IC-1 differentiation. Subsequently, upregulation of RALDH2 expression in the suburothelial mesenchyme leads to RA synthesis, which promotes IC-1 differentiation toward an S cell phenotype, leading to restoration of urothelial barrier function. (C) During repair of mucosal defects, the process described in (A) occurs. In parallel, host IC-1 cells invade the remodeling tissue and their progeny undergo S cell differentiation in response to RA.

References

    1. Abraham S.N., Miao Y. The nature of immune responses to urinary tract infections. Nat. Rev. Immunol. 2015;15:655–663. - PMC - PubMed
    1. Algarrahi K., Franck D., Ghezzi C.E., Cristofaro V., Yang X., Sullivan M.P., Chung Y.G., Affas S., Jennings R., Kaplan D.L. Acellular bi-layer silk fibroin scaffolds support functional tissue regeneration in a rat model of onlay esophagoplasty. Biomaterials. 2015;53:149–159. - PMC - PubMed
    1. Balsara Z.R., Li X. Sleeping beauty: awakening urothelium from its slumber. Am. J. Physiol. Renal Physiol. 2017;312:F732–F743. - PMC - PubMed
    1. Gandhi D., Molotkov A., Batourina E., Schneider K., Dan H., Reiley M., Laufer E., Metzger D., Liang F., Liao Y. Retinoid signaling in progenitors controls specification and regeneration of the urothelium. Dev. Cell. 2013;26:469–482. - PMC - PubMed
    1. Indra A.K., Warot X., Brocard J., Bornert J.M., Xiao J.H., Chambon P., Metzger D. Temporally-controlled site-specific mutagenesis in the basal layer of the epidermis: comparison of the recombinase activity of the tamoxifen-inducible Cre-ER(T) and Cre-ER(T2) recombinases. Nucleic Acids Res. 1999;27:4324–4327. - PMC - PubMed

Publication types

MeSH terms