. 2017 Dec 7;21(6):761-774.e5.
doi: 10.1016/j.stem.2017.09.008. Epub 2017 Nov 22.

Injury Induces Endogenous Reprogramming and Dedifferentiation of Neuronal Progenitors to Multipotency

Affiliations

Injury Induces Endogenous Reprogramming and Dedifferentiation of Neuronal Progenitors to Multipotency

Brian Lin et al. Cell Stem Cell. .

Abstract

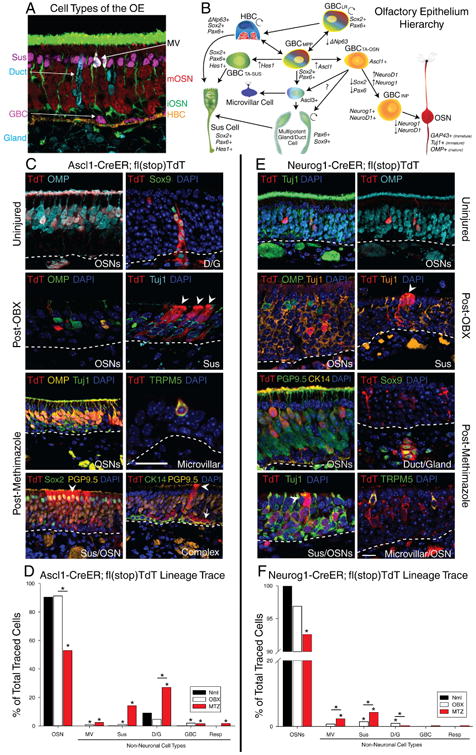
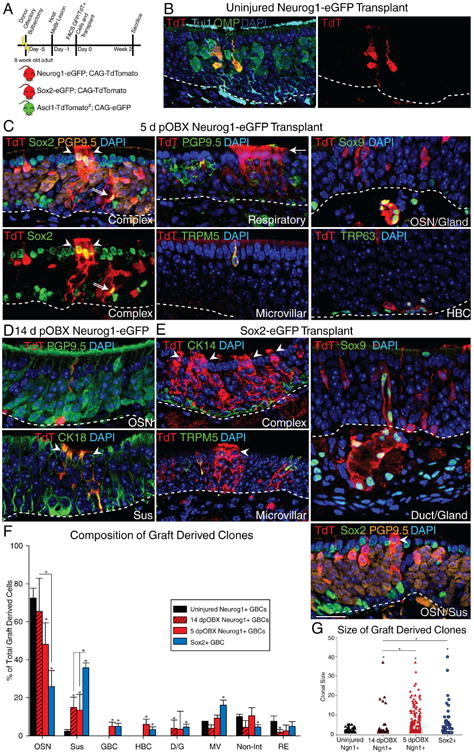
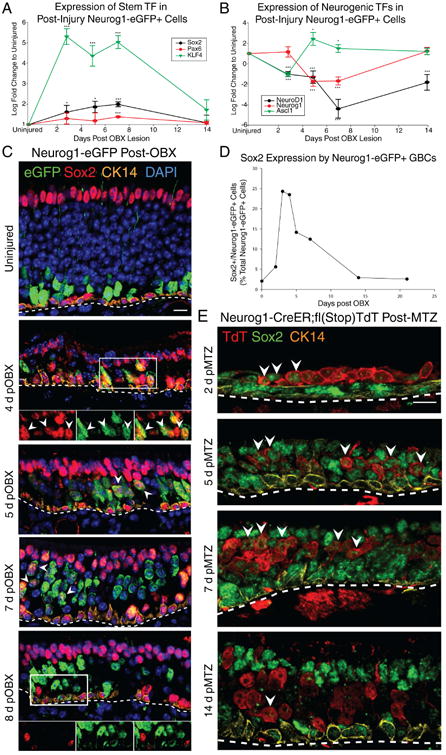
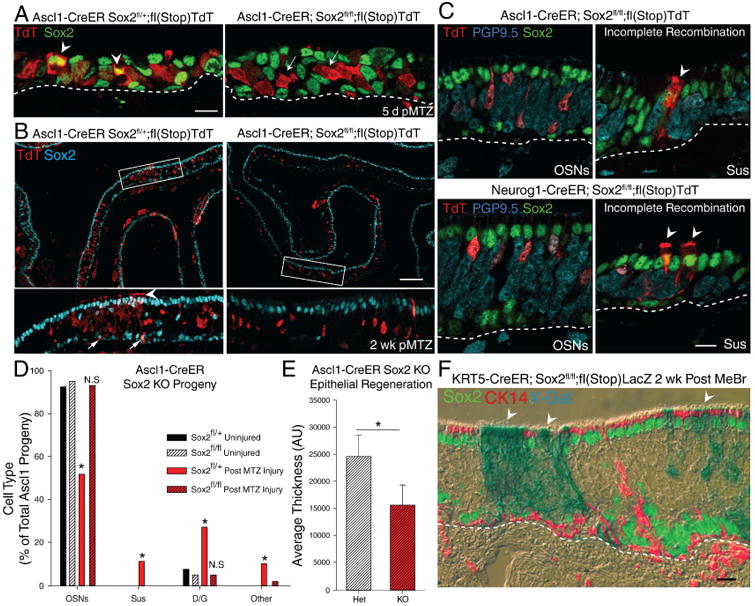
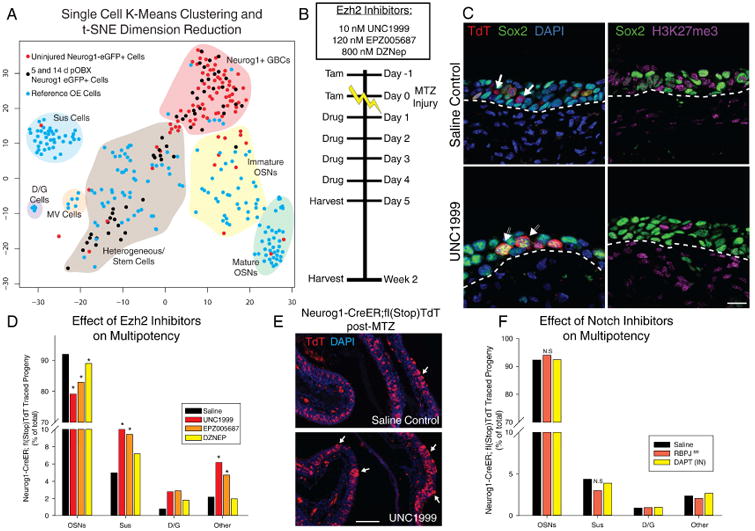
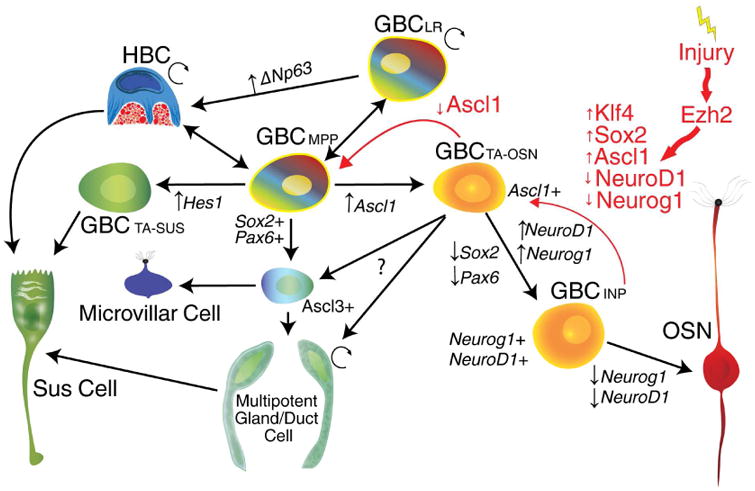
Adult neurogenesis in the olfactory epithelium is often depicted as a unidirectional pathway during homeostasis and repair. We challenge the unidirectionality of this model by showing that epithelial injury unlocks the potential for Ascl1+ progenitors and Neurog1+ specified neuronal precursors to dedifferentiate into multipotent stem/progenitor cells that contribute significantly to tissue regeneration in the murine olfactory epithelium (OE). We characterize these dedifferentiating cells using several lineage-tracing strains and single-cell mRNA-seq, and we show that Sox2 is required for initiating dedifferentiation and that inhibition of Ezh2 promotes multipotent progenitor expansion. These results suggest that the apparent hierarchy of neuronal differentiation is not irreversible and that lineage commitment can be overridden following severe tissue injury. We elucidate a previously unappreciated pathway for endogenous tissue repair by a highly regenerative neuroepithelium and introduce a system to study the mechanisms underlying plasticity in the OE that can be adapted for other tissues.

Keywords: adult neurogenesis; dedifferentiation; olfactory epithelium; reprogramming.


Figures

Figure 1
Figure 1. Ascl1+ and Neurog1+ Progenitors are Neuronally Specified until Injury Unlocks a Multipotent State
(A) IHC of major cell types of the OE. OMP (Red) – Mature OSN; Tuj1 (Green) – Immature OSN; TRPM5 (White) – Microvillar cell; apical Sox2 (Purple) – Sus cell; Sox9/Aqp5 (Cyan) – D/G cells; basal Sox2+ (Cyan)/CK14- (Gold) – GBCs; CK14 (Gold) – HBCs. (B) Stem cell hierarchical model of olfactory epitheliopoiesis. (C) IHC of clones generated by Ascl1-CreER GBCs in uninjured, 14 days post-OBX, and 14 days post-Methimazole conditions. The arrowheads indicate non-neuronal Sus cells, while the arrow points to a GBC. The scale bar in the microvillar panel equals 10 μm and applies only to the panel it is in. (D) Counts of total cells of each type identified under each type of Ascl1 lineage trace, depicted as a percentage of total traced cells across replicates (n = 6). (E) IHC of clones generated by each type of Neurog1-CreER GBCs in all three conditions. The scale bar equals 10 μm and applies to all other panels. (F) Counts of total cells of each type identified under each type of Neurog1 lineage trace, depicted as before (n = 6). * p < 0.05, Kruskal-Wallis ANOVA on Ranks. Unless otherwise noted, comparisons are to uninjured controls (Nml). See also Figure S1.
Figure 2
Figure 2. Induced Multipotent Progenitors Transplant and Maintain Their Multipotent State
(A) Experimental paradigm for challenging progenitor cell capacity by transplantation into lesioned hosts and schematic of donor reporter mice used. (B) IHC of clones generated 14 days post-engraftment of uninjured Neurog1+ GBCs. (C) IHC of clones generated 14 days post-engraftment of 5 days post-OBX Neurog1+ GBCs. The two left-most panels are different images of the same field to highlight the complexity of the clone. In all panels, the arrowheads mark non-neuronal Sus cells, the double arrow marks a Sox2+ GBC, and the arrow marks the ciliary mat characteristic of columnar respiratory cells. The asterisks mark TRP63+ HBCs. (D) IHC of clones generated 14 days post-engraftment of 14 days post-OBX Neurog1+ GBCs. (E) IHC of clones generated 14 days post-engraftment from positive control Sox2+ GBCs. The scale bar equals 10 μm and applies to all panels. (F) Counts of cells of each type of graft-derived cells, as a percentage of total (n=3). * p < 0.05, Kruskal-Wallis ANOVA on Ranks. (G) Clonal size analysis of engrafted cells (n = 3). *p < 0.05, Mann-Whitney Rank Sum Test. See also Figure S2
Figure 3
Figure 3. Expression Profiling of OSKM Reprogramming Factors and Other Likely Mediators
(A) qRT-PCR of Sox2, KLF4 and Pax6 in FACS-isolated Neurog1+ GBCs as a function of survival time after OBX. (B) qRT-PCR of neurogenic transcription factors in the same samples. * p<0.05, *** p < 0.001, ANOVA. (C) IHC for Sox2, Neurog1-eGFP and CK14 as a function of time after bulbectomy. Arrowheads mark examples of eGFP+/Sox2+ cells. The scale bar equals 10 μm. (D) Counts of double positive Sox2+/Neurog1-eGFP+ cells by IHC, depicted as a percentage of all Neurog1-eGFP+ cells as a function of time after bulbectomy. (E) IHC for Sox2 following Neurog1-CreER-mediated lineage tracing as a function of time post-methimazole (MTZ) injury. The scale bar equals 10 μm. See also Figure S3
Figure 4
Figure 4. Sox2 is Required for Induced Multipotency
IHC of Sox2 protein expression following Ascl1-CreER-driven Sox2 excision in mice that are either heterozygous or homozygous for the floxed Sox2 allele 5 days post-methimazole (MTZ). The arrowheads indicate TdT+/Sox2+ cells, while the arrows indicate TdT+/Sox2- cells. The scale bar represents 10 μm. Low-magnification image of Ascl1-CreER-driven excision in floxed Sox2 heterozygotes vs. homozygotes with lineage trace 2 weeks post-MTZ. The arrowhead marks Sus cells, the arrows mark self-renewed Sox2+ GBCs. The scale bar represents 100 μm. (C) High magnification of IHC of clones generated in the floxed Sox2 homozygous animals co-stained with Sox2. Arrowheads indicate Sus cells that failed to completely recombine and still express Sox2 demonstrating that recombination is occasionally incomplete. The scale bar represents 10 μm. (D) Counts of cell types generated in heterozygous vs homozygous floxed Sox2 mice (n = 3) after verifying Sox2 IHC negativity. * p < 0.05, Kruskal-Wallis ANOVA on Ranks. (E) Average tissue thickness 2 weeks after injury (n=3); * p < 0.001 two-tailed T-test. (F) IHC of K5-CreER-mediated Sox2 knockout and lineage trace post-injury, X-gal (blue in phase contrast) overlaid with fluorescent IHC for Sox2 (green) and CK14 (red). The scale bar equals 10 μm. See also Figure S4
Figure 5
Figure 5. Single Cell Transcriptional Profiling and Validation of Functional Pathways
(A) t-distributed stochastic neighbor embedding (t-SNE) dimension reduction of single cell transcriptomes. Blue cells were cells sampled from uninjured OE; red cells are Neurog1-eGFP+ FACS isolated cells from uninjured tissue; black cells are isolated from 5 and 14 dpOBX tissue. Shaded areas and labels represent generalized, manually-identified cell groups. (B) Experimental paradigm of dosing with interventional small molecules. (C) IHC of H3K27me3 and Sox2 with vehicle or Ezh2 inhibitor UNC1999, 5 days after methimazole (MTZ) injury. The scale bar equals 10 μm. (D) Quantification of the effect of Ezh2 inhibition on progeny after injury using three inhibitors with different potencies plotted as a total percentage of cell types across replicates (n = 3). (E) Low mag image of saline treated vs. UNC1999 treated Neurog1 lineage trace. Arrows mark locations of assumed multipotency yielding Sus cells. The scale bar equals 100 μm (F) Quantification of Notch inhibition using DAPT or RBPJ genetic knockout depicted as in (D) (n = 3). * p < 0.05, Kruskal-Wallis ANOVA on Ranks. See also Figure S5
Figure 6
Figure 6. Working Model
(A) Compiled working model with black arrows representing the bulk flow of cell fate during regeneration with red arrows representing the proposed path taken by dedifferentiating cells during the initial response to injury.

Comment in

References

    1. Bergström U, Giovanetti A, Piras E, Brittebo EB. Methimazole-Induced Damage in the Olfactory Mucosa: Effects on Ultrastructure and Glutathione Levels. Toxicol Pathol. 2003;31:379–387. doi: 10.1080/01926230390201101. - DOI - PubMed
    1. Bermingham-McDonogh O, Reh TA. Regulated reprogramming in the regeneration of sensory receptor cells. Neuron. 2011;71:389–405. doi: 10.1016/j.neuron.2011.07.015. - DOI - PMC - PubMed
    1. Campbell JE, Kuntz KW, Knutson SK, Warholic NM, Keilhack H, Wigle TJ, Raimondi A, Klaus CR, Rioux N, Yokoi A, et al. EPZ011989, A Potent, Orally-Available EZH2 Inhibitor with Robust in Vivo Activity. ACS Med Chem Lett. 2015;6:491–495. doi: 10.1021/acsmedchemlett.5b00037. - DOI - PMC - PubMed
    1. Cau E, Gradwohl G, Fode C, Guillemot F. Mash1 activates a cascade of bHLH regulators in olfactory neuron progenitors. Development. 1997;124:1611–1621. - PubMed
    1. Chen M, Tian S, Yang X, Lane AP, Reed RR, Liu H. Wnt-Responsive Lgr5+ Globose Basal Cells Function as Multipotent Olfactory Epithelium Progenitor Cells. J Neurosci. 2014;34:8268–8276. doi: 10.1523/JNEUROSCI.0240-14.2014. - DOI - PMC - PubMed