. 2018 Mar 1;83(5):456-465.
doi: 10.1016/j.biopsych.2017.10.019. Epub 2017 Oct 26.

Brain Regions Showing White Matter Loss in Huntington's Disease Are Enriched for Synaptic and Metabolic Genes

Collaborators, Affiliations

Brain Regions Showing White Matter Loss in Huntington's Disease Are Enriched for Synaptic and Metabolic Genes

Peter McColgan et al. Biol Psychiatry. .

Abstract

Background: The earliest white matter changes in Huntington's disease are seen before disease onset in the premanifest stage around the striatum, within the corpus callosum, and in posterior white matter tracts. While experimental evidence suggests that these changes may be related to abnormal gene transcription, we lack an understanding of the biological processes driving this regional vulnerability.

Methods: Here, we investigate the relationship between regional transcription in the healthy brain, using the Allen Institute for Brain Science transcriptome atlas, and regional white matter connectivity loss at three time points over 24 months in subjects with premanifest Huntington's disease relative to control participants. The baseline cohort included 72 premanifest Huntington's disease participants and 85 healthy control participants.

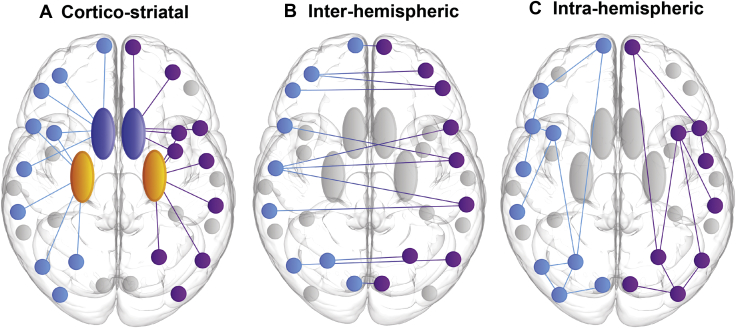
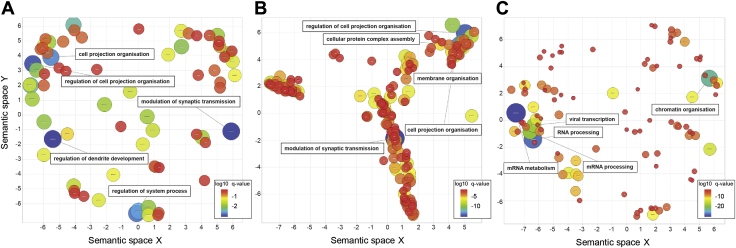
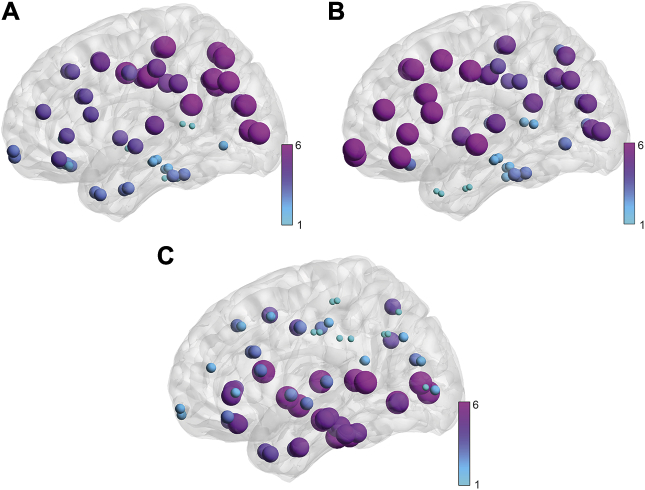
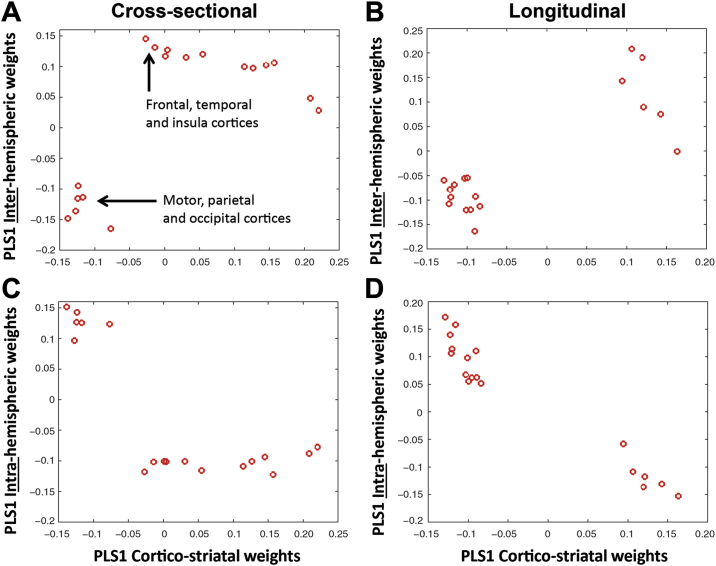
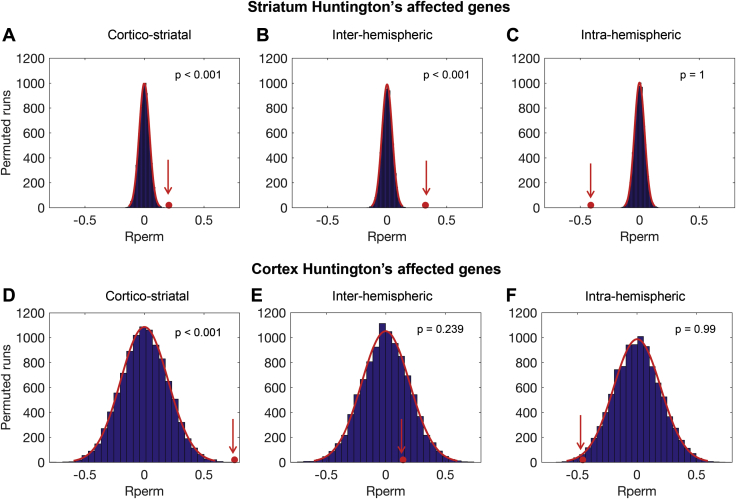
Results: We show that loss of corticostriatal, interhemispheric, and intrahemispheric white matter connections at baseline and over 24 months in premanifest Huntington's disease is associated with gene expression profiles enriched for synaptic genes and metabolic genes. Corticostriatal gene expression profiles are predominately associated with motor, parietal, and occipital regions, while interhemispheric expression profiles are associated with frontotemporal regions. We also show that genes with known abnormal transcription in human Huntington's disease and animal models are overrepresented in synaptic gene expression profiles, but not in metabolic gene expression profiles.

Conclusions: These findings suggest a dual mechanism of white matter vulnerability in Huntington's disease, in which abnormal transcription of synaptic genes and metabolic disturbance not related to transcription may drive white matter loss.

Keywords: Connectome; Genetics; Huntington's disease; Imaging; Transcription; White matter.


Figures

Figure 1
Figure 1
Schematic illustrating subgroups of regional white matter connectivity. (A) Corticostriatal: connections between cortex and striatum (caudate and putamen) for each cortical region of interest. (B) Interhemispheric: connections to the opposite hemisphere for each cortical region of interest. (C) Intrahemispheric: connections within the same hemisphere for each cortical region of interest. Light blue indicates the left hemisphere, purple indicates the right hemisphere, dark blue indicates the caudate, and yellow indicates the putamen.
Figure 2
Figure 2
Significant gene ontology (GO) terms for biological processes associated with the first component of the partial least squares analysis are plotted in semantic space, where similar terms are clustered together. (A) Corticostriatal cross-sectional analysis semantic similarity scatter plot. (B) Interhemispheric cross-sectional analysis semantic similarity scatter plot. (C) Intrahemispheric cross-sectional analysis semantic similarity scatter plot. In all plots, the top five most significant GO terms are labeled for each analysis. Redundant GO terms and those associated with greater than 1000 genes have been excluded. Markers are scaled based on the log10 q value for the significance of each GO term. Large blue circles are highly significant, while red circles are less significant (see color bar). mRNA, messenger RNA.
Figure 3
Figure 3
Region of interest weights for cross-sectional partial least squares regression analyses: (A) corticostriatal, (B) interhemispheric, and (C) intrahemispheric. Brain regions displayed on brain mesh. Size and color of region indicates size of region of interest weight (ranked from smallest [1] to largest [6]). See color map.
Figure 4
Figure 4
Dissociation of corticostriatal and inter- and intrahemispheric gene enrichment in the cortex. (A) Region of interest (ROI) weights for the first partial least squares (PLS) component of the cross-sectional analysis for interhemispheric vs. corticostriatal. (B) ROI weights for the first PLS component of the longitudinal analysis for interhemispheric vs. corticostriatal. (C) ROI weights for the first PLS component of the cross-sectional analysis for intrahemispheric vs. corticostriatal. (D) ROI weights for the first PLS component of the longitudinal analysis for intrahemispheric vs. corticostriatal. Each red circle represents a cortical ROI. PLS1, first partial least squares component.
Figure 5
Figure 5
Enrichment of genes showing abnormal transcription in Huntington’s disease (HD) in the first partial least squares (PLS) component for the cross-sectional analyses. (A) Corticostriatal analysis, HD striatum genes. (B) Interhemispheric analysis, HD striatum genes. (C) Intrahemispheric analysis, HD striatum genes. (D) Corticostriatal analysis, HD cortex genes. (E) Interhemispheric analysis, HD cortex genes. (F) Intrahemispheric analysis, HD cortex genes. The red circle illustrates the mean weight (on the x axis) for the gene list of interest in the first PLS component. The y axis represents the number of permutations of random genes from the first PLS component. Gene lists overexpressed in the first PLS component have a mean greater than that of the random permutations (red circle to the right of the permutation distribution). Rperm, random permutation mean.

References

    1. Bates G.P., Dorsey R., Gusella J.F., Hayden M.R., Kay C., Leavitt B.R. Huntington disease. Nat Rev Dis Primers. 2015;1:15005. - PubMed
    1. Tabrizi S.J., Scahill R.I., Durr A., Roos R.A., Leavitt B.R., Jones R. Biological and clinical changes in premanifest and early stage Huntington's disease in the TRACK-HD study: The 12-month longitudinal analysis. Lancet Neurol. 2011;10:31–42. - PubMed
    1. Dumas E.M., van den Bogaard S.J., Ruber M.E., Reilman R.R., Stout J.C., Craufurd D. Early changes in white matter pathways of the sensorimotor cortex in premanifest Huntington's disease. Hum Brain Mapp. 2012;33:203–212. - PMC - PubMed
    1. Di Paola M., Luders E., Cherubini A., Sanchez-Castaneda C., Thompson P.M., Toga A.W. Multimodal MRI analysis of the corpus callosum reveals white matter differences in presymptomatic and early Huntington's disease. Cereb Cortex. 2012;22:2858–2866. - PubMed
    1. Faria A.V., Ratnanather J.T., Tward D.J., Lee D.S., van den Noort F., Wu D. Linking white matter and deep gray matter alterations in premanifest Huntington disease. Neuroimage Clin. 2016;11:450–460. - PMC - PubMed

Publication types

MeSH terms