. 2018 Jan;20(1):12-24.
doi: 10.1016/j.neo.2017.10.004. Epub 2017 Nov 23.

PTEN-Dependent Stabilization of MTSS1 Inhibits Metastatic Phenotype in Pancreatic Ductal Adenocarcinoma

Affiliations

PTEN-Dependent Stabilization of MTSS1 Inhibits Metastatic Phenotype in Pancreatic Ductal Adenocarcinoma

Ann E Zeleniak et al. Neoplasia. 2018 Jan.

Abstract

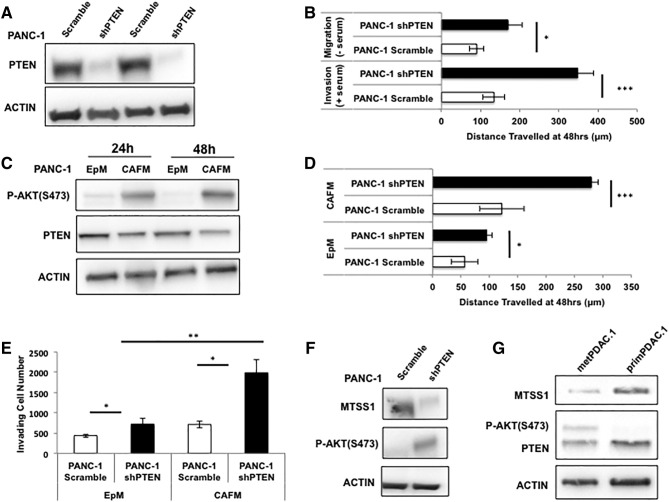
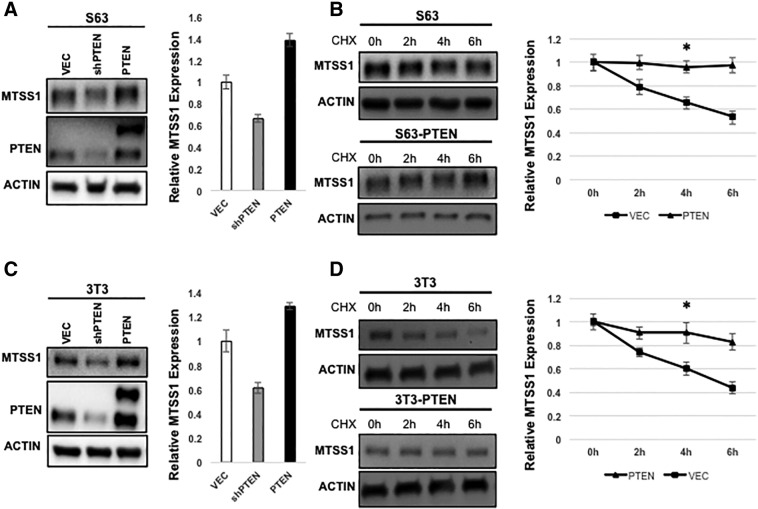
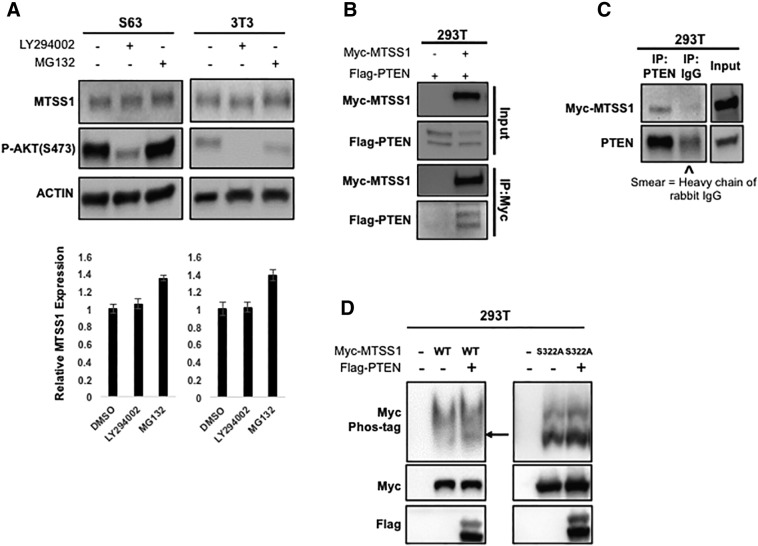
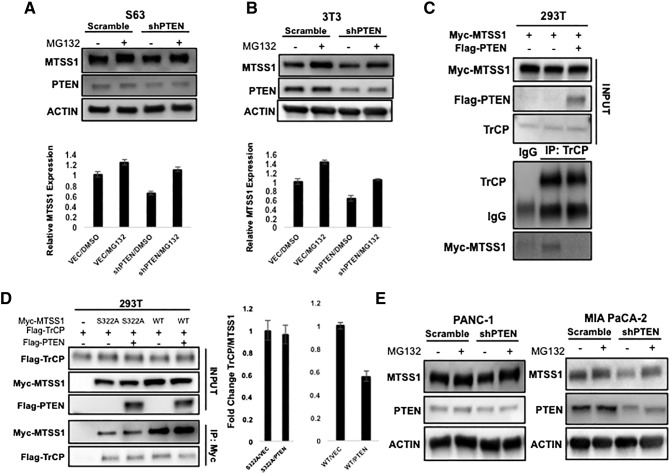
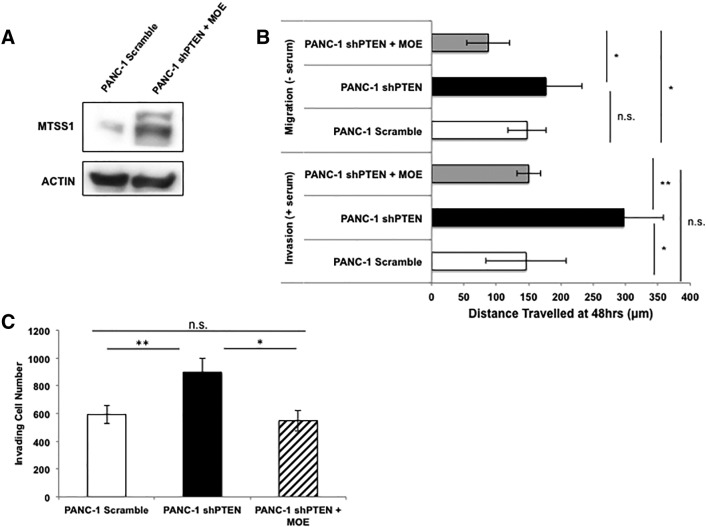
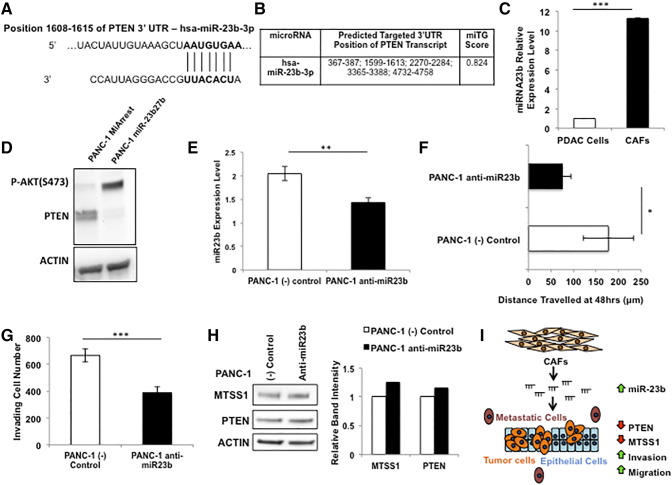
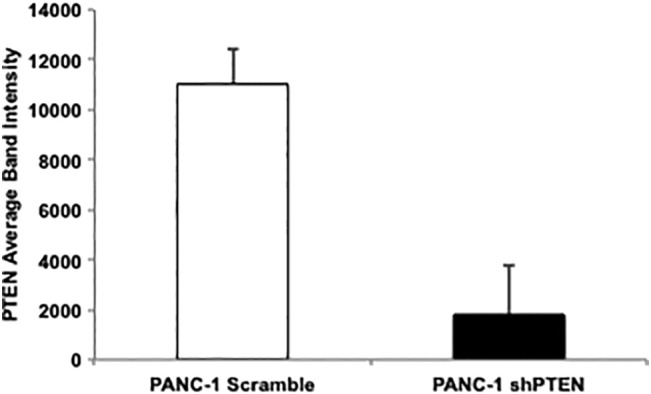
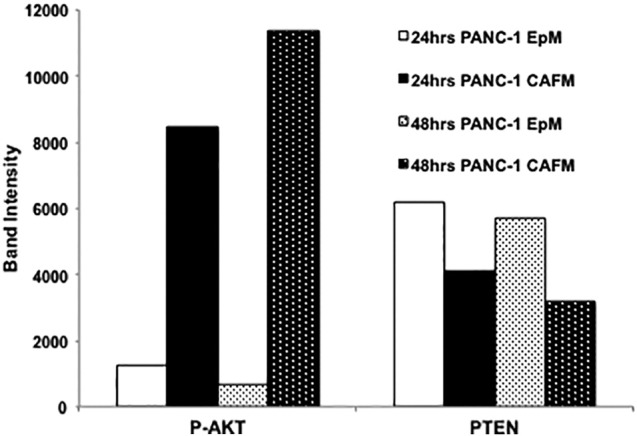
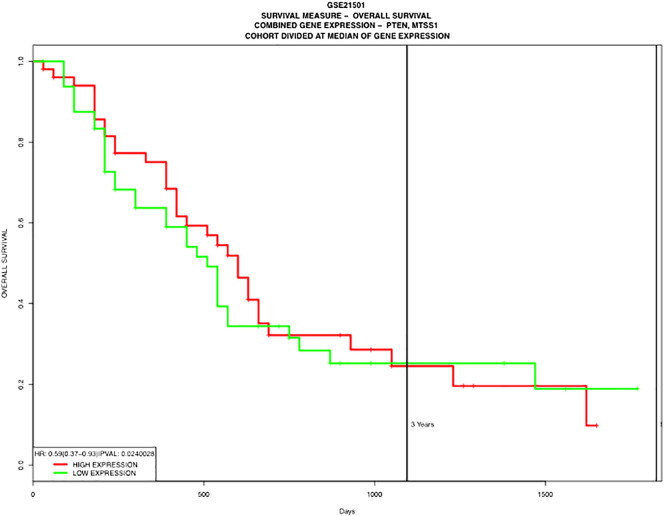
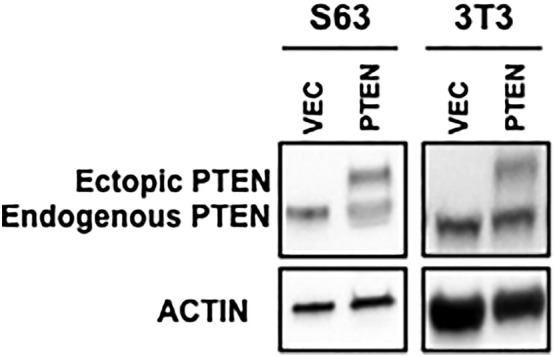
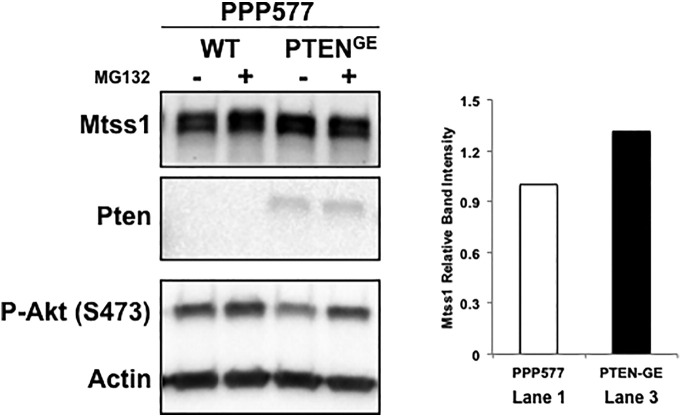
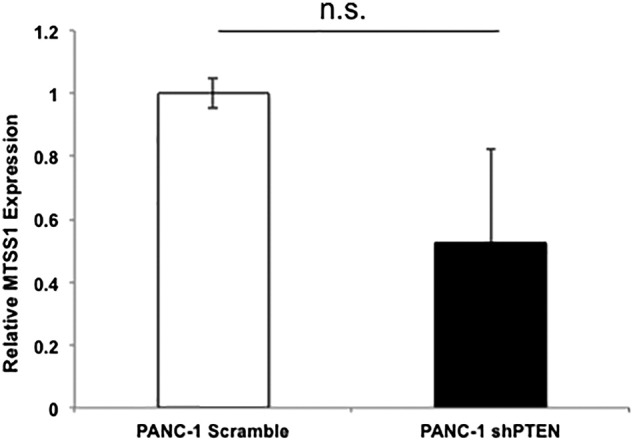
Pancreatic ductal adenocarcinoma (PDAC) presents at metastatic stage in over 50% of patients. With a survival rate of just 2.7% for patients presenting with distant disease, it is imperative to uncover novel mechanisms capable of suppressing metastasis in PDAC. Previously, we reported that the loss of metastasis suppressor protein 1 (MTSS1) in PDAC cells results in significant increase in cellular migration and invasion. Conversely, we also found that overexpressing MTSS1 in metastatic PDAC cell lines corresponds with not only decreased metastatic phenotype, but also greater overall survival. While it is known that MTSS1 is downregulated in late-stage PDAC, the mechanism behind that loss has not yet been elucidated. Here, we build off our previous findings to present a novel regulatory mechanism for the stabilization of MTSS1 via the tumor suppressor protein phosphatase and tensin homolog (PTEN). We show that PTEN loss in PDAC cells results in a decrease in MTSS1 expression and increased metastatic potential. Additionally, we demonstrate that PTEN forms a complex with MTSS1 in order to stabilize and protect it from proteasomal degradation. Finally, we show that the inflammatory tumor microenvironment, which makes up over 90% of PDAC tumor bulk, is capable of downregulating PTEN expression through secretion of miRNA-23b, potentially uncovering a novel extrinsic mechanism of MTSS1 regulation. Collectively, these data offer new insight into the role and regulation of MTSS1in suppressing tumor cell invasion and migration and help shed light as to what molecular mechanisms could be leading to early cell dissemination in PDAC.


Figures

Figure 1
Figure 1
Loss of PTEN results in increased invasion and migration. (A) Western blot confirmation of stable PANC-1 shPTEN cell pool as compared to Scramble control. (B) PANC-1 Scramble and shPTEN cells were plated, and a scratch assay was performed in both serum-free (top) and serum-containing (bottom) conditions. PANC-1 shPTEN cells were able to move across the scratch significantly farther than PANC-1 Scramble cells in both conditions. (C) PANC-1 cells were cultured in PANC-1 EpM or CAFM and harvested at various timepoints. Lysates were analyzed via Western blot, and it was seen that PANC-1 cells cultured in CAFM expressed less PTEN as time went on, which was accompanied by a robust upregulation of P-AKT. (D) PANC-1 Scramble and shPTEN cells were plated, and a scratch assay was performed in either EpM or CAFM conditions. PANC-1 shPTEN cells traveled significantly farther across the scratch, and that phenomenon was augmented in the presence of CAFM, in which the PANC-1 shPTEN cells traveled more than two-fold farther than PANC-1 Scramble control cells. (E) PANC-1 Scramble and shPTEN cells were plated, and a Transwell invasion assay was performed in either EpM or CAFM conditions. PANC-1 shPTEN cells invaded significantly more through the Transwell membrane; however, that significance was increased in shPTEN cells cultured in CAFM. (F) Western blot analysis of PANC-1 Scramble and shPTEN cells shows that MTSS1 expression decreases in PANC-1 shPTEN cells. (G) Western blot analysis of both metastatic (metPDAC.1) and primary (primPDAC.1) PDAC patient cell lysates shows metastatic patient sample containing decreased PTEN and MTSS1 expression. *P value < .05, **P value < .001, ***P value < .0001.
Figure 2
Figure 2
PTEN stabilizes MTSS1 expression levels. (A) MTSS1 protein level is positively regulated by PTEN in S63 fibroblast cells. PTEN overexpression increases MTSS1 protein level, and PTEN knockdown decreases MTSS1 protein level. Cell lysates of S63 cells, which were transfected with control, PTEN, or shPTEN, were analyzed by Western blot. MTSS1 levels were normalized against β-actin. (B) PTEN increases MTSS1 stability in S63 cells. S63 cells stably expressing vector or PTEN were treated with CHX (20 μg/ml) for indicated times. Endogenous MTSS1 protein levels were determined. Relative MTSS1 levels were normalized against β-actin. In (C) and (D), the same assays were carried out in NIH3T3 fibroblast cells and showed similar results. Data are represented as mean ± SEM. *P value < .05, **P value < .001.
Figure 3
Figure 3
PTEN is a protein phosphatase for MTSS1. (A) In both S63 and NIH3T3 fibroblast cells, inhibition of PI3K does not increase MTSS1 protein level. Cells were treated with PI3K inhibitor LY294002 (30 μM) for 6 hours. MG132 (10 μM for 6 hours) treatment was included as indicator of increased MTSS1. S473 (pAKT) was detected as positive control for LY294002 treatment. Cell lysates were analyzed by Western blot. Panels (B) and (C) show that PTEN and MTSS1 are in the same protein complex. (B) PTEN was co-transfected with MTSS1 into 293T cells as indicated. (C) Myc-MTSS1 was transfected in 293T cells. PTEN and MTSS1 associations were examined by reciprocal co-IP as indicated. “^” indicates the presence of the heavy chain of rabbit IgG. (D) PTEN decreases the phosphorylation level of MTSS1. PTEN was co-transfected with MTSS1 or MTSS1S322A into 293T cells as indicated. The phosphorylation level of MTSS1 was determined by the phos-tag gel. Data are represented as mean ± SEM.
Figure 4
Figure 4
PTEN blocks proteasome degradation of MTSS1. (A and B) MG132 blocks PTEN knockdown-induced decrease of MTSS1 protein levels in both S63 and NIH3T3 fibroblast cells. S63 and NIH3T3 fibroblast cells stably expressing Scramble or shPTEN were treated with MG132 (10 μM) for 6 hours. Endogenous MTSS1 protein levels were determined along with the β-actin control. (C and D) The indicated plasmids were transfected into 293T cells. Co-IP was performed to determine the interaction between MTSS1 and β-TrCP. When overexpressing PTEN, the interaction between MTSS1 and β-TrCP decreased in reciprocal co-IP. Overexpression of PTEN does not affect the interaction between MTSS1S322A and β-TrCP. (E) MG132 blocks PTEN knockdown-induced decrease of MTSS1 protein levels in PDAC cell lines. PANC-1 and MIA PaCa-2 epithelial cells transfected with Scramble or shPTEN were treated with MG132 (10 μM) for 6 hours. Endogenous MTSS1 protein levels were determined along with the β-actin control. Data are represented as mean ± SEM. **P value < .001.
Figure 5
Figure 5
Increase in MTSS1 expression results in decreased invasion and migration in PTEN-deficient cells. (A) PANC-1 cells were stably transduced with either Scramble control vector or shPTEN knockdown plasmid. PANC-1 shPTEN cells were then transiently transfected with Myc-MTSS1 plasmid, and MTSS1 overexpression was confirmed via Western blot. (B) PANC-1 Scramble, shPTEN, and shPTEN + MOE cells were plated, and a scratch assay was performed in both serum-free (top) and serum-containing (bottom) conditions. Cells that were deficient in PTEN expression moved significantly further across the wound in both conditions, but upon overexpression of MTSS1 in those same cells, there was no significant difference denoted when compared to Scramble control. (C) PANC-1 Scramble, shPTEN, and shPTEN + MOE cells were plated, and a Transwell invasion assay was performed in the presence of Matrigel. PANC-1 shPTEN cells invaded through the membrane significantly more often than Scramble control until MTSS1 was overexpressed, and then no significant difference was seen. *P value < .05, **P value < .001.
Figure 6
Figure 6
Manipulation of miRNA-23b leads to altered cellular invasion, migration, and PTEN and MTSS1 expression. (A) Schematic of miR-23b binding site in PTEN mRNA 3′ UTR sequence at nucleotide position 1608 to 1615. (B) DIANA LAB miTG prediction score of the probability that miR-23b will target PTEN. The closer to 1.0 the miTG score, the higher the probability of targeting. (C) qPCR analysis of relative miR-23b expression levels in PDAC epithelial cells or PDAC CAFs. (D) PANC-1 cells were transiently transfected with miR-23b27b cluster plasmid. These cells showed robust loss of PTEN expression upon Western blot examination. (E) qPCR confirmation of PANC-1 cells transiently transfected with anti–miR-23b inhibitor. (F) PANC-1 cells treated with anti–miR-23b were significantly less able to travel across the wound in a scratch assay setting as compared to (−) control. (G) PANC-1 cells treated with anti–miR-23b were significantly less able to travel through a Matrigel-coated membrane in a Transwell invasion assay setting as compared to (−) control. (H) Treatment of PANC-1 cells with anti–miR-23b resulted in an increase in expression levels of both PTEN and MTSS1 as confirmed via Western blot analysis. (I) Schematic for the hypothesized mechanism of action for the downregulation of MTSS1 via PTEN loss. The dense tumor microenvironment, majorly composed of CAFs, contains higher amounts of miRNA-23b. miRNA-23b is then secreted to the PDAC tumor epithelium, where it targets PTEN, downregulating it. This downregulation leaves MTSS1 unstabilized from proteasomal degradation and thus results in loss of MTSS1 and thereby increased metastatic potential. *P value < .05, **P value < .001, ***P value < .0001.
Supplemental Figure 1
Supplemental Figure 1.
Quantitation of Figure 1A Western blot confirming the loss of PTEN in stable PANC-1 shPTEN cell pool as compared to Scramble control.
Supplemental Figure 2
Supplemental Figure 2.
Quantitation of Figure 1C Western blot denoting the loss of PTEN expression and the increase in P-AKT expression in CAFM conditions at both 24- and 48-hour time points.
Supplemental Figure 3
Supplemental Figure 3.
Kaplan-Meier survival curve of patient dataset GSE21501 indicating that loss of both PTEN and MTSS1 in patients leads to significantly worse overall patient survival (P = .024).
Supplemental Figure 4
Supplemental Figure 4.
Western blot confirmation of endogenous and ectopic PTEN after transfection in S63 (left) and NIH3T3 cells (right).
Supplemental Figure 5
Supplemental Figure 5.
Western blot showing implications of mutating PTEN lipid phosphatase activity, leaving only its protein phosphatase activity as viable. As can be seen in lanes 1 and 3, cells with mutated lipid phosphatase activity (PTENG129E) not only were able to maintain Mtss1 levels but in fact were able to moderately increase them when compared to the control P577 Pten−/− cells in lane 1.
Supplemental Figure 6
Supplemental Figure 6.
RT-PCR data indicating no significant difference in MTSS1 mRNA expression levels between PANC-1 Scramble and shPTEN cell lines. (P value = .336168).

Similar articles

Cited by

References

    1. Society. AC . The Society; Atlanta, GA: 2010. Cancer Facts and Figures; p. v.
    1. Siegel RL, Miller KD, Jemal A. Cancer statistics. CA Cancer J Clin. 2016;66(1):7–30. - PubMed
    1. Loncle C, Bonjoch L, Folch-Puy E, Lopez-Millan MB, Lac S, Molejon MI, Chuluyan E, Cordelier P, Dubus P, Lomberk G. IL17 Functions through the Novel REG3beta-JAK2-STAT3 Inflammatory Pathway to Promote the Transition from Chronic Pancreatitis to Pancreatic Cancer. Cancer Res. 2015;75(22):4852–4862. - PMC - PubMed
    1. Loncle C, Molejon MI, Lac S, Tellechea JI, Lomberk G, Gramatica L, Fernandez Zapico MF, Dusetti N, Urrutia R, Iovanna JL. The pancreatitis-associated protein VMP1, a key regulator of inducible autophagy, promotes Kras(G12D)-mediated pancreatic cancer initiation. Cell Death Dis. 2016;7:e2295. - PMC - PubMed
    1. Steeg PS. Targeting metastasis. Nat Rev Cancer. 2016;16(4):201–218. - PMC - PubMed

Publication types

MeSH terms