. 2018 Jan 31;39(1):014004.
doi: 10.1088/1361-6579/aa9d60.

Characteristic impedance: frequency or time domain approach?

Affiliations

Characteristic impedance: frequency or time domain approach?

M Umar Qureshi et al. Physiol Meas. .

Abstract

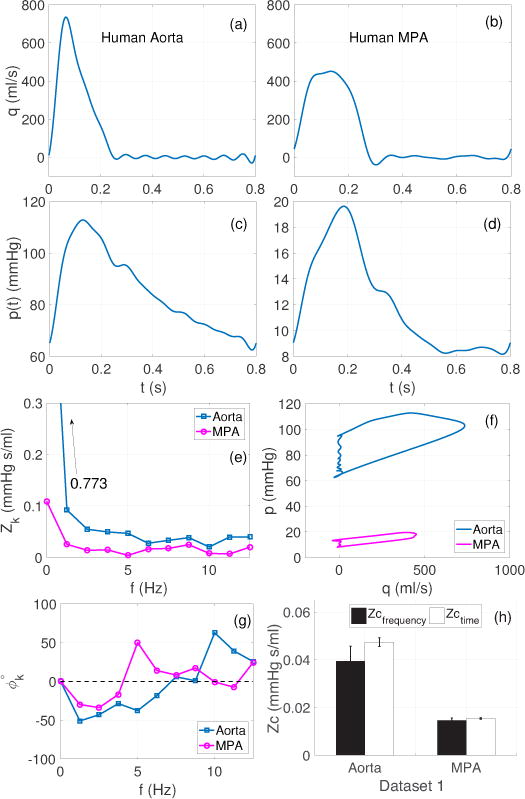
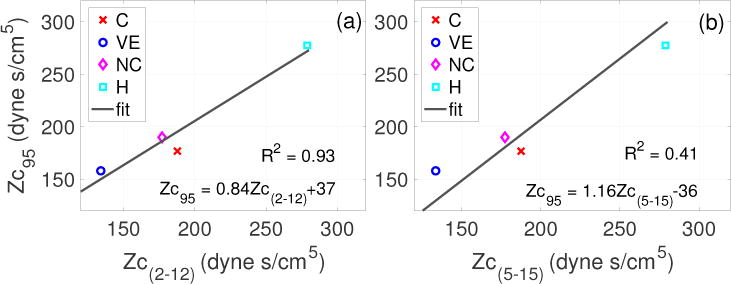
Objective: Characteristic impedance (Zc) is an important component in the theory of hemodynamics. It is a commonly used metric of proximal arterial stiffness and pulse wave velocity. Calculated using simultaneously measured dynamic pressure and flow data, estimates of characteristic impedance can be obtained using methods based on frequency or time domain analysis. Applications of these methods under different physiological and pathological conditions in species with different body sizes and heart rates show that the two approaches do not always agree. In this study, we have investigated the discrepancies between frequency and time domain estimates accounting for uncertainties associated with experimental processes and physiological conditions.

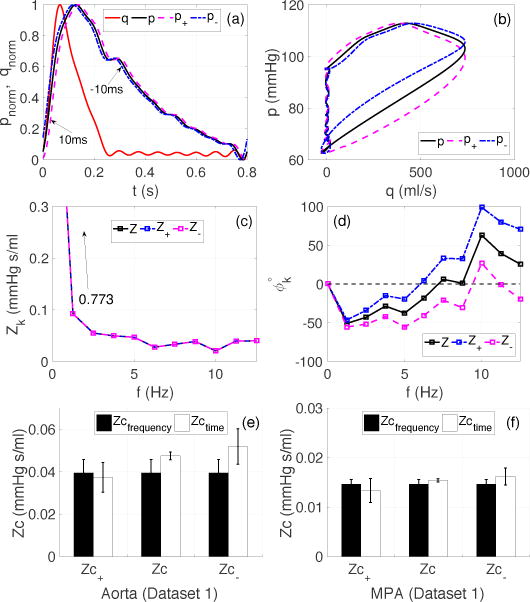
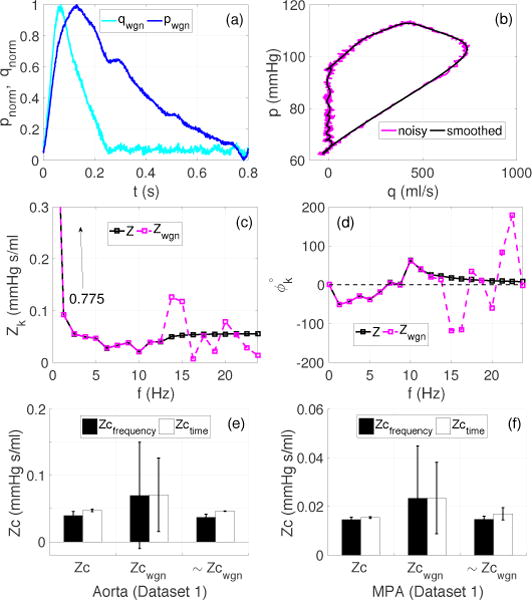
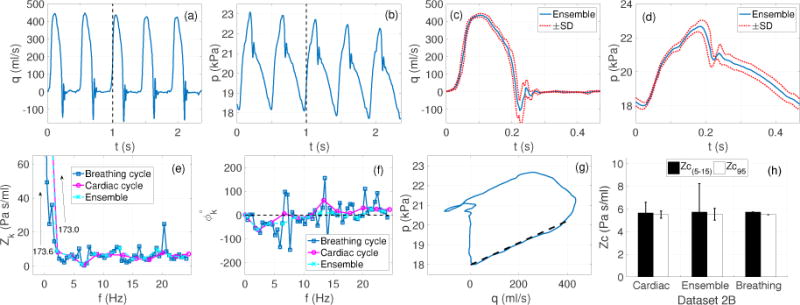
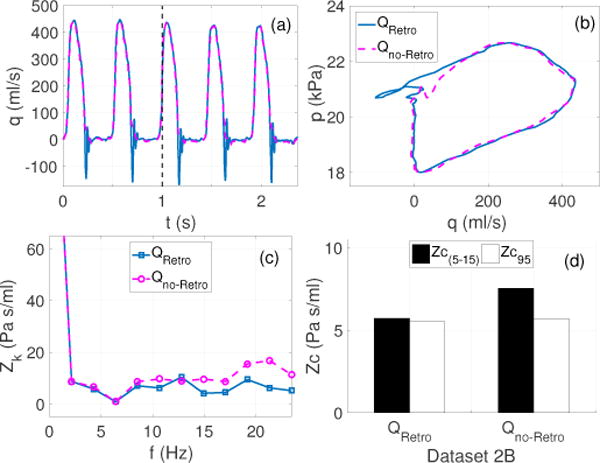
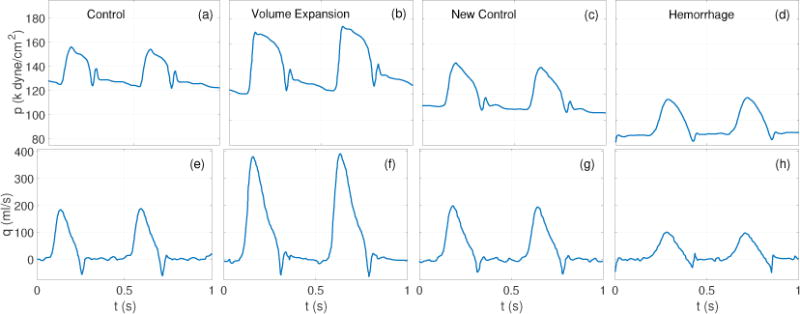
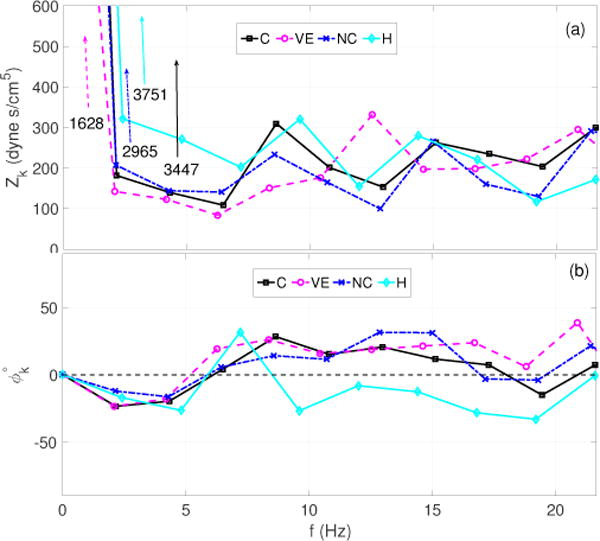
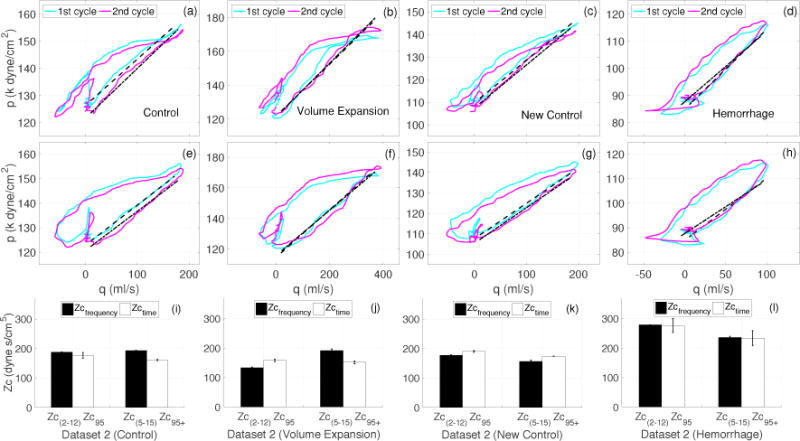
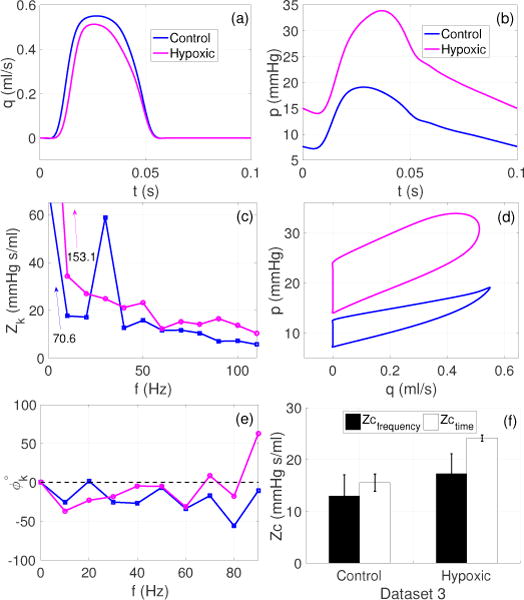
Approach: We have used published data measured in different species including humans, dogs, and mice to investigate: (a) the effects of time delay and signal noise in the pressure-flow data, (b) uncertainties about the blood flow conditions, (c) periodicity of the cardiac cycle versus the breathing cycle, on the frequency and time domain estimates of Zc, and (d) if discrepancies observed under different hemodynamic conditions can be eliminated. Main results and Significance: We have shown that the frequency and time domain estimates are not equally sensitive to certain characteristics of hemodynamic signals including phase lag between pressure and flow, signal to noise ratio and the end of systole retrograde flow. The discrepancies between two types of estimates are inherent due to their intrinsically different mathematical expressions and therefore it is impossible to define a criterion to resolve such discrepancies. Considering the interpretation and role of Zc as an important hemodynamic parameter, we suggest that the frequency and time domain estimates should be further assessed as two different hemodynamic parameters in a future study.


Figures

Figure 1
Figure 1
Dataset 1 (Section 2.1): Frequency and time domain analysis using pressure and flow wave forms from the human aorta and main pulmonary artery (MPA). (a)–(d): pressure (left), flow (right). Note the difference in scale between the aortic and MPA pressures. (e) and (g): corresponding impedance moduli and phase spectra, (f): pressure-flow loops, used for estimating Zc with the time domain up-slope methods, (h): comparison of Zc in the aorta and MPA across both domains. The bars show mean ± SD values of Zc, across all the frequency and time domain methods listed in Table 1.
Figure 2
Figure 2
Case 1 (Dataset 1): Effects of a time-lag between pressure and flow on the Zc estimates. (a): Normalized pressure and flow (dimensionless) in the aorta; p+ and p denote the forward and backward shifted wave by 10 ms. (b): Effect of a 10 ms time shift on the early ejection phase of the pressure-flow loop (in units of mmHg and ml/s), (c)–(d): impedance moduli (mmHg s/ml) and phase spectra (degrees), (e)–(f): effects of time-lag on the resultant Zc values for the aorta and MPA. Zc± correspond to the Zc estimates obtained using p±.
Figure 3
Figure 3
Case 2 (Dataset 1): Effects of noise on the Zc estimates. (a): Normalized pressure and flow waveforms (dimensionless) in the aorta, contaminated with Gaussian white noise generating a 40 dB SNR, (b): pressure-flow loops from normal (see Figure 1 (a)) and noisy pressure (pwgn) and flow (qwgn) signals, (c)–(d) impedance moduli and phase for the first 19 harmonics computed using normal (Z) and noisy (Zwgn) datasets, (e)–(f): effects of noise on the grouped averaged Zc for the aorta and MPA, where Zc and Zcwgn are the group averaged Zc accounting for all the methods listed in Table 1. ~Zcwgn excludes all frequency domain methods, which require harmonics above 12.5 Hz, and the peak derivative method (Zc′) in the time domain.
Figure 4
Figure 4
Case 3 (Dataset 2B): Effects of single beat, breathing cycle (multi-beat) and ensemble encoding approach on the Zc estimates (Murgo et al 1980). (a)–(b): Pressure and flow data over five cardiac cycles reproduced with permission from Dujardin & Stone (1981) (c)–(d): ensemble encoding (blue curves)±SD (dotted red curves) of the flow and pressure waveforms, (e)–(f): impedance moduli and phase spectra obtained by subjecting all five cycles (blue curve representing breathing cycle analysis), a representative cardiac cycle (magenta curve representing beat by beat analysis) and ensemble encoding (cyan curve), to the Fourier analysis (g): the pressure-flow loop (blue curve) from the ensemble encoded waveform with the fitted line at qc = 0.95 (dashed balck), (h): comparison of Zc(5–15) and Zc95 using the three approaches: (left) the cardiac cycle approach, error bars show mean±SD Zc values over five cardiac cycles analyzed individually, (center) ensemble encoding approach, the error bars show the estimates corresponding to dotted red curves in (c) and (d), (right) breathing cycle approach.
Figure 5
Figure 5
Case 4 (Modified dataset 2B): Effects of retrograde flow at the end of systole examined using a frequency and time domain estimate. (a): The original flow from Figure 4 (solid blue) with retrograde flow (QRetro), and modified flow (dashed meganta) without retrograde flow (Qno–Retro), (b): corresponding pressure-flow loops from ensemble encoding, (c): corresponding impedance moduli spectra including 0–11 harmonics, (d): comparison of Zc(5–15) and Zc95 in the presence and absence of the retrograde flow.
Figure 6
Figure 6
Dataset 2A: Pressure (top row) and flow (bottom row) waveforms reproduced with permission from Dujardin et al (Dujardin et al 1980). The measurements were recorded in a dog ascending aorta under four d flow conditions, labeled in top row panels. Variations in the cycle lengths should be noted for each flow condition.
Figure 7
Figure 7
Dataset 2A: Impedance moduli (a) and phase spectra (b) corresponding to each case (C, VE, NC and H) presented in Figure 6. The spectra are generated using the second cardiac cycle in the in the sequence of pressure and flow waveforms and only show 0–10 harmonics after the mean component.
Figure 8
Figure 8
Case 4 (Dataset 2A): Comparison of frequency and time domain estimates of Zc calculated form the dataset 2A (Figs. 7 and 6. (a)–(d): Pressure-flow loops with qc = 0.95 providing Zc95. (e)–(h): Pressure-flow loops with pressure delayed by 7 ms, and qc = 0.95 providing modified Zc95+, (i)–(l): comparison of frequency domain Zc(2–12), Zc(5–15) (see Table 1) with time domain Zc95 and Zc95+. The bar charts show the mean±SD of all estimates computed from each cardiac cycle shown in Figure 6.
Figure 9
Figure 9
Case 4 (Dataset 2A): Following Murgo et al (1980), regression line depicting the linear relationship between Zc95 and Zc(2–12) (a), and Zc95 and Zc(5–15). Coefficient of correlation, R2, is 0.93 and 0.41, respectively.
Figure 10
Figure 10
Dataset 3. Estimates of Zc in mice pulmonary arteries during control and hypoxia. (a)–(b): Representative pressure (p) and flow (q) waveforms plotted for one cardiac cycle for the control and hypoxic groups, (c) and (e): corresponding impedance moduli (Zk) and phases (ϕk) spectra for 0–10 harmonics, (d): corresponding pressure-flow loops for the control and hypoxic cases, and (f): comparison of frequency and time domain estimates where the bars show the mean ± SD values of Zc, across all the frequency and time domain methods listed in Table 1.

References

    1. Abel FL. Fourier analysis of left ventricular performance. Circ Res. 1971;28:119–35. - PubMed
    1. Bak Z, Sjoberg F, Rousseau A, Steinvall I, Janerot-Sjoberg B. Human cardiovascular dose-response to supplemental oxygen. Acta Physiologica. 2007;191:15–24. - PubMed
    1. Bergel DH, Milnor WH. Pulmonary vascular impedance in dog. Circ Res. 1965;16:401–15. - PubMed
    1. Bollache E, Kachenoura N, Bargiotas I, Giron A, Cesare AD, Bensalah M, Lucor D, Redheuil A, Mousseaux E. How to estimate aortic characteristic impedance from magnetic resonance and applanation tonometry data? J Hypertension. 2015;33:575–83. - PubMed
    1. Borlotti A, Li Y, Parker KH, Khir AW. Experimental evaluation of local wave speed in the presence of reflected waves. J Biomech. 2014;47:87–95. - PubMed

Publication types