. 2017 Nov 24;8(1):1769.
doi: 10.1038/s41467-017-01965-8.

HIF drives lipid deposition and cancer in ccRCC via repression of fatty acid metabolism

Affiliations

HIF drives lipid deposition and cancer in ccRCC via repression of fatty acid metabolism

Weinan Du et al. Nat Commun. .

Abstract

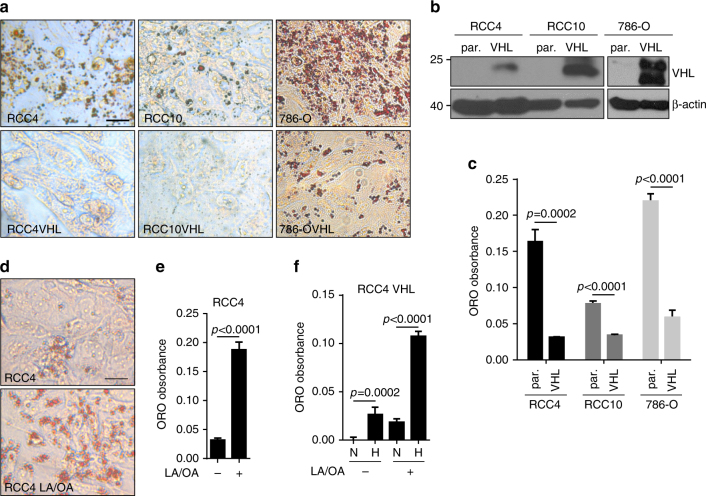
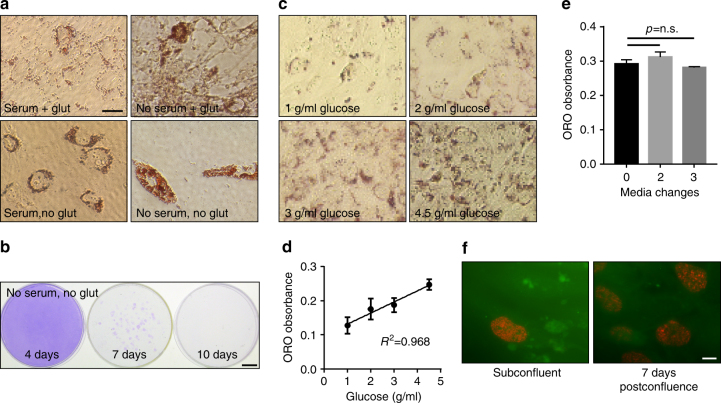
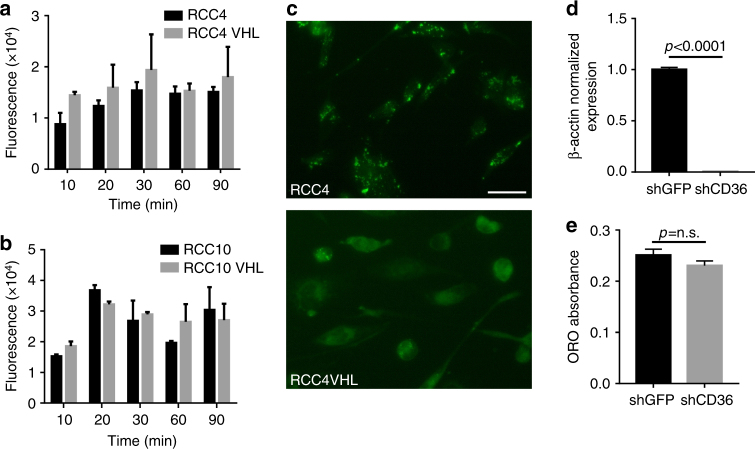
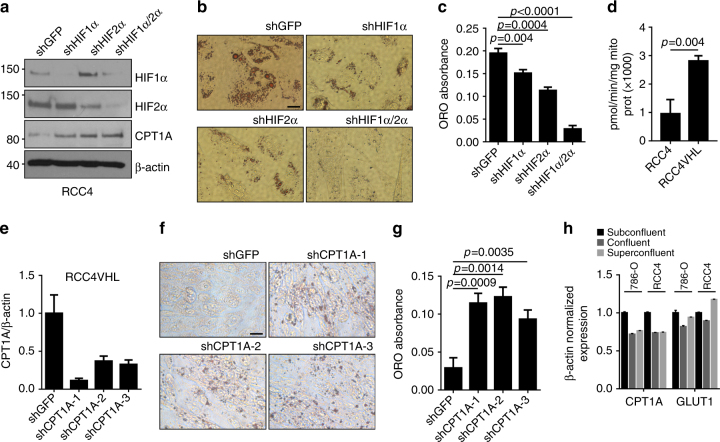
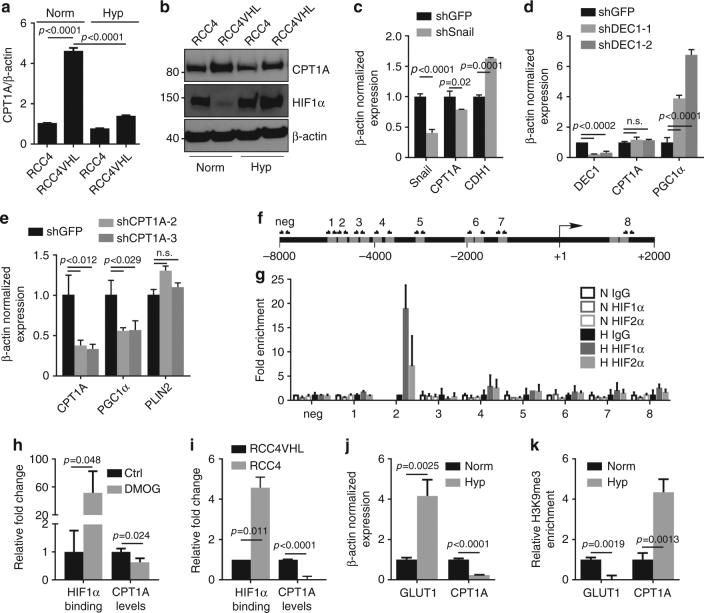
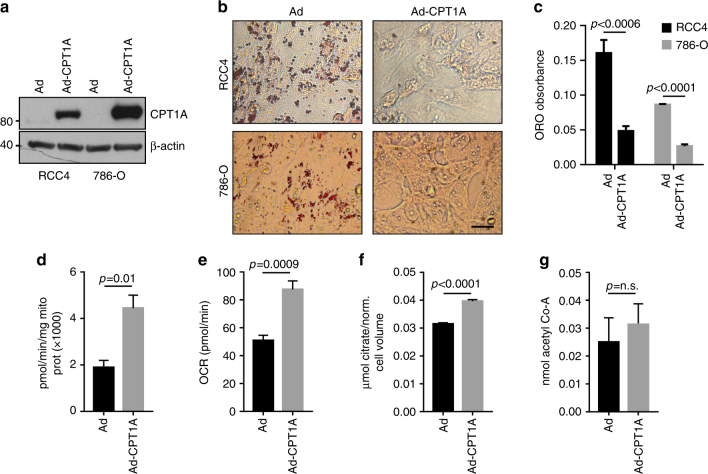
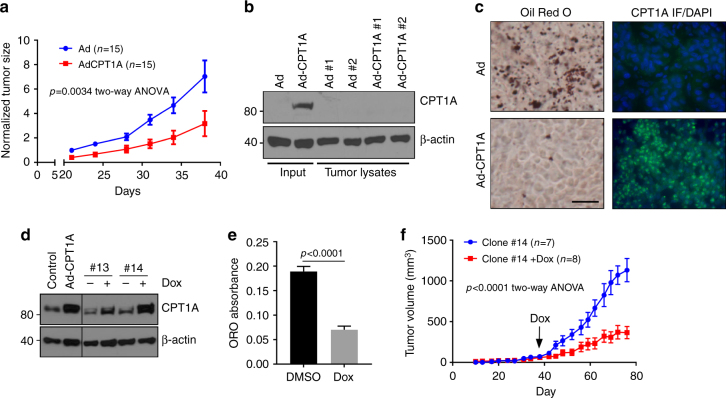
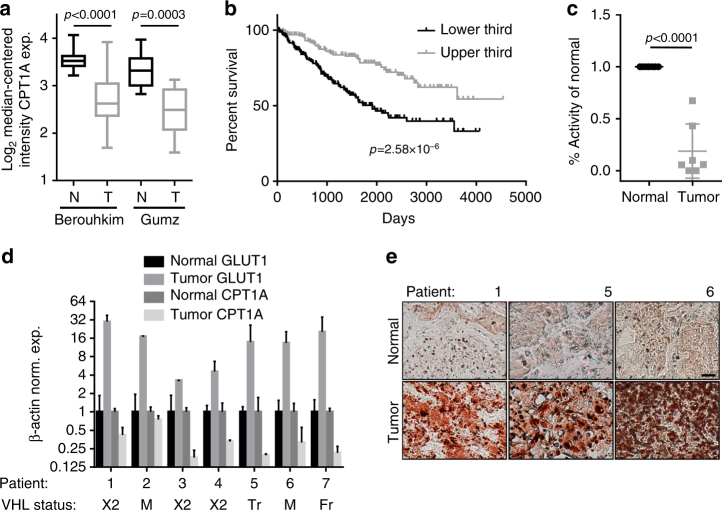
Clear cell renal cell carcinoma (ccRCC) is histologically defined by its lipid and glycogen-rich cytoplasmic deposits. Alterations in the VHL tumor suppressor stabilizing the hypoxia-inducible factors (HIFs) are the most prevalent molecular features of clear cell tumors. The significance of lipid deposition remains undefined. We describe the mechanism of lipid deposition in ccRCC by identifying the rate-limiting component of mitochondrial fatty acid transport, carnitine palmitoyltransferase 1A (CPT1A), as a direct HIF target gene. CPT1A is repressed by HIF1 and HIF2, reducing fatty acid transport into the mitochondria, and forcing fatty acids to lipid droplets for storage. Droplet formation occurs independent of lipid source, but only when CPT1A is repressed. Functionally, repression of CPT1A is critical for tumor formation, as elevated CPT1A expression limits tumor growth. In human tumors, CPT1A expression and activity are decreased versus normal kidney; and poor patient outcome associates with lower expression of CPT1A in tumors in TCGA. Together, our studies identify HIF control of fatty acid metabolism as essential for ccRCC tumorigenesis.


Conflict of interest statement

The authors declare no competing financial interests.

Figures

Fig. 1
Fig. 1
Lipid accumulation in ccRCC cells is VHL dependent. a Photomicrographs of RCC4, RCC10, and 786-O renal cell lines with or without VHL stained with Oil Red O 6 days after reaching confluence. b Western blot demonstrating VHL expression in reconstituted lines. β-actin used as loading control. c Quantification of Oil Red O extracted from cells shown in a. d Oil Red O staining of RCC4 cells 2 days after treatment with linoleic/oleic acid (LA/OA). e Quantification of Oil Red O staining of cells in d. f Quantification of Oil Red O staining of RCC4 VHL cells treated with LA/OA cultured in either normoxia (N) or 1% oxygen (H). Statistical tests for all panels were two-tailed Student’s t tests. Scale bar = 10 μm. Error bars represent standard deviations
Fig. 2
Fig. 2
Lipid accumulation is dependent on glucose, but independent of glutamine. a Photomicrographs of Oil Red O-stained 786-O cells cultured in the presence or absence of serum and glutamine, as indicated. Bar = 10 μm. b Crystal violet staining of rescued cells from treatment as in a. Bar = 1 cm. c Photomicrographs of Oil Red O-stained 786-O cells cultured in indicated glucose concentrations. d Quantification of Oil Red O of cells in c and graphed versus glucose concentration. Square of the Pearson correlation coefficient r is shown. e Quantification of Oil Red O of 786-O cells with media changes 0, 2, or 3 times during the 7-day period. f Fluorescent labeling of BrdU incorporation of 786-O cells at subconfluent or at 7 days post confluence. Bar = 10 μm. p values of two-tailed Student’s t tests are displayed. Error bars represent standard deviations
Fig. 3
Fig. 3
Lipid deposition in VHL-deficient cells is not due to altered fatty acid import. a Quantification of fluorescence in RCC4 and RCC4 VHL cells at indicated times after exposure to BODIPY-dodecanoic acid. b Quantification of fluorescence in RCC10 and RCC10 VHL cells at indicated times after exposure to BODIPY-dodecanoic acid. c Representative fluorescent images of BODIPY-labeled RCC4 and RCC4 VHL cells at 24 h after exposure to BODIPY-dodecanoic acid. Bar = 10 μm. d Quantitative real-time PCR detection of CD36 expression after shRNA knockdown. e Quantification of Oil Red O staining of RCC4 cells with shGFP or shCD36 knockdown. Error bars represent standard deviations. p values of two-tailed Student’s t tests are displayed
Fig. 4
Fig. 4
CPT1A repression controls lipid deposition in ccRCC cells. a Western blot of RCC4 cell lysates expressing shRNA to HIF1α and HIF2α decorated with antibodies to HIF1α, HIF2α, CPT1A, and β-actin. b Photomicrographs of RCC4 cells with HIF1α and HIF2α knockdown stained for Oil Red O. c Quantification of Oil Red O staining of cells in b. d CPT1A activity measurement in RCC4 and RCC4 VHL mitochondria. e Quantitative real-time PCR of CPT1A (qRTPCR) expression in RCC4 VHL cells expressing three different CPT1A shRNA constructs. f Photomicrographs of Oil Red O-stained RCC4 VHL cells with CPT1A knockdown. Bar = 10 μm. g Quantification of cells in e. h Quantification of CPT1A and GLTU1 expression in subconfluent, confluent, or superconfluent 786-O and RCC4 cells. Error bars represent standard deviations. p values of two-tailed Student’s t tests are displayed
Fig. 5
Fig. 5
HIF1 and HIF2 bind CPT1A and inhibit expression. a mRNA expression of CPT1A in RCC4 and RCC4 VHL cells in normoxia or hypoxia as measured by qRTPCR normalized to β-actin. b Western blot depicting protein expression of CPT1A, HIF1α, and β-actin in RCC4 cells in normoxia or hypoxia for 24 h. c Quantification of the effect of shRNA knockdown of Snail in RCC4 cells on CPT1A and CDH1 (E-cadherin) expression. d Quantification of the effect of shRNA knockdown of DEC1 with two different shRNAs in RCC4 cells on CPT1A and PGC1α expression. e Quantification of the effect of shRNA knockdown of CPT1A in RCC4 cells on PGC1α and PLIN2 expression. f Diagram of the CPT1A promoter region analyzed for putative HREs (gray boxes) 8000 base pairs upstream to 2000 base pairs downstream of the transcriptional start site (+1). Primer pairs used for PCR amplification after ChIP are indicated. g qRTPCR results using primers pairs indicated in f of ChIP with antisera to HIF1α or HIF2α performed on RCC4 VHL chromatin after treating the cells with normoxia (open boxes) or hypoxia (closed boxes) for 24 h. h HIF1α ChIP on the CPT1A region 2 HRE in lysates of RCC4 VHL cells treated with DMOG for 36 h (“HIF1α binding”) compared with CPT1A RT-PCR (“CPT1A levels”). i HIF1α ChIP on the CPT1A region 2 HRE in lysates of normoxic RCC4 and RCC4 VHL cells. j mRNA expression of GLUT1 and CPT1A in RCC4 VHL cells in normoxia or hypoxia as measured by qRTPCR normalized to β-actin. k qRTPCR results of histone H3 lysine 9 trimetylation ChIP on the GLUT1 and CPT1A promoters of RCC4 VHL cells in normoxia or hypoxia. Error bars represent standard deviations. p values of two-tailed Student’s t tests are displayed
Fig. 6
Fig. 6
CPT1A expression prevents lipid deposition and alters mitochondrial function in ccRCC cells. a Western blots of RCC4 and 786-O cell lysates after adenoviral infection with CPT1A of GFP-expressing adenovirus stained for CPT1A or β-actin. b Photomicrographs of Oil Red O staining of RCC4 or 786-O cells after infection with GFP or CPT1A adenovirus. Bar = 10 μm. c Quantification of Oil Red O staining depicted in b. d CPT1A activity measurement in adenovirally infected RCC4 cells. e Oxygen consumption rate (OCR) of adenovirally infected RCC4 cells. f Citrate levels in adenovirally infected RCC4 cells. g Acetyl-CoA levels adenovirally infected RCC4 cells. Error bars represent standard deviations. p values of two-tailed Student’s t tests are displayed
Fig. 7
Fig. 7
CPT1A expression limits tumor growth of ccRCC cells in vivo. a Tumor growth measurements of 786-O cells infected with GFP or CPT1A-expressing adenovirus implanted on the flanks of nude mice. b Western blot of various protein lysates extracted from tumors measured in a stained for CPT1A and β-actin levels. c Photomicrographs of Oil Red O staining and immunofluorescent staining of a GFP and CPT1A tumor described in a. Immunofluorescence was performed with a FITC-labeled secondary antibody and counterstained with DAPI. Bar = 20 μm. d Western blot of depicting doxycycline-inducible CPT1A expression in two 786-O clonal cell lines compared to adenoviral-infected control cell lines. Blots were probed for CPT1A and β-actin. e Quantification of Oil Red O staining of clone #14 treated with or without doxycycline. f Tumor growth measurements of clone #14 implanted subcutaneously into the flanks of nude mice. Doxycycline food was given to the Dox cohort when average tumor volumes reached ~100 mm3 through to the end of the assay. Error bars represent standard deviations. p values for two-way ANOVAs for a, f, and a two-tailed Student’s t test (e) are displayed
Fig. 8
Fig. 8
CPT1A expression and activity are reduced in ccRCC tumor tissue. a Box and whisker plots of Oncomine data demonstrating decreased expression of CPT1A mRNA in two studies. Data are depicted as Log2 transformed, median-centered intensity expression of CPT1A mRNA in normal (N) versus tumor (T). In the Berouhkim data set, CPT1A is repressed 1.82-fold; in the Gumz data set, CPT1A is repressed 1.79-fold. b Kaplan–Meier survival plot of patients with upper and lower third expression of CPT1A from the TCGA (n = 172 for each group). c Activity measurements of CPT1 in mitochondria isolated from clear cell renal carcinoma tumors versus adjacent normal tissues in seven patients. Data are presented as % change compared to the activity in matched normal tissues. d Normalized expression of GLUT1 and CPT1A in tumor and normal tissues of ccRCC patient samples from c, as well as VHL status indicated below (×2 = exon 2 deletion, M = mutation, Tr = truncation, Fr = frame shift). e Representative Oil Red O staining of three patient tumor samples and normal kidneys, as indicated. Bar = 20 μm. p values of two-tailed Student’s t tests are displayed (a, c) and Log-rank test (b)

References

    1. Ericsson JL, Seljelid R, Orrenius S. Comparative light and electron microscopic observations of the cytoplasmic matrix in renal carcinomas. Virchows. Arch. Pathol. Anat. Physiol. Klin. Med. 1966;341:204–223. doi: 10.1007/BF00961071. - DOI - PubMed
    1. Cancer Genome Atlas Research Network. T. Comprehensive molecular characterization of clear cell renal cell carcinoma. Nature. 2013;499:43–49. doi: 10.1038/nature12222. - DOI - PMC - PubMed
    1. Young AC, et al. Analysis of VHL gene alterations and their relationship to clinical parameters in sporadic conventional renal cell carcinoma. Clin. Cancer Res. 2009;15:7582–7592. doi: 10.1158/1078-0432.CCR-09-2131. - DOI - PMC - PubMed
    1. Nickerson ML, et al. Improved identification of von Hippel-Lindau gene alterations in clear cell renal tumors. Clin. Cancer Res. 2008;14:4726–4734. doi: 10.1158/1078-0432.CCR-07-4921. - DOI - PMC - PubMed
    1. Kaelin WG., Jr. The von Hippel-Lindau tumour suppressor protein: O2 sensing and cancer. Nat. Rev. Cancer. 2008;8:865–873. doi: 10.1038/nrc2502. - DOI - PubMed

Publication types

MeSH terms

Substances