. 2017 Nov 24;7(1):16318.
doi: 10.1038/s41598-017-16284-7.

Regulation of mating type switching by the mating type genes and RME1 in Ogataea polymorpha

Affiliations

Regulation of mating type switching by the mating type genes and RME1 in Ogataea polymorpha

Katsuyoshi Yamamoto et al. Sci Rep. .

Abstract

Saccharomyces cerevisiae and its closely related yeasts undergo mating type switching by replacing DNA sequences at the active mating type locus (MAT) with one of two silent mating type cassettes. Recently, a novel mode of mating type switching was reported in methylotrophic yeast, including Ogataea polymorpha, which utilizes chromosomal recombination between inverted-repeat sequences flanking two MAT loci. The inversion is highly regulated and occurs only when two requirements are met: haploidy and nutritional starvation. However, links between this information and the mechanism associated with mating type switching are not understood. Here we investigated the roles of transcription factors involved in yeast sexual development, such as mating type genes and the conserved zinc finger protein Rme1. We found that co-presence of mating type a1 and α2 genes was sufficient to prevent mating type switching, suggesting that ploidy information resides solely in the mating type locus. Additionally, RME1 deletion resulted in a reduced rate of switching, and ectopic expression of O. polymorpha RME1 overrode the requirement for starvation to induce MAT inversion. These results suggested that mating type switching in O. polymorpha is likely regulated by two distinct transcriptional programs that are linked to the ploidy and transmission of the starvation signal.


Conflict of interest statement

The authors declare that they have no competing interests.

Figures

Figure 1
Figure 1
Mating type genes are not required for the MAT inversion. (a) a 2 gene is required for mating with α cell but not with a cell. Wild-type and a 2∆ strains of ura3–1 (BY4330 and HPH922, respectively) and wild-type, ste2∆ and ste3∆ strains of leu1–1 (HPH22, HPH553, and HPH581, respectively) genotypes were combined on MEMA mating medium and incubated at 30 °C. After 24 h, cells were spread on SD plates to select for Leu+Ura+ diploids. Colony number was counted after 2-day incubation at 37 °C. The average of three independent crosses is shown. Error bars indicate SD. (b) Function of mating type genes in establishing mating type identity. Grey circle represents centromere. (c) Schematic of the primer designs for PCR reactions specific to I(a)- or A(α)-type chromosomes (MAT PCR analysis). (d) I(a)- or A(α)-type of MAT chromosome was determined by PCR reactions described in (c). PCR reactions to detect I(a)- or A(α)-type chromosomes are designated as a and α and designated a Genomic DNA samples were prepared from the wild-type strain (HPH1047 and HPH1050) and deletion mutants for MAT a1, MAT a2, or MATα (HPK073, HPH1255, and HPK072) before (+N) and after incubation on MEMA medium (−N). CDC28-specific primer set was added to all PCR reactions as controls for the amount of input DNA. Full-length gels are presented in Supplementary Figure S5.
Figure 2
Figure 2
a1-α2 inhibits the MAT inversion. (a) MATα haploid cells (HPH848) and MATα/MAT a(IR2∆) diploid cells (HPH964) were grown in YPDS medium (+N) and transferred to MEMA medium and incubated for 18 hrs (−N). Genomic DNA samples were prepared and digested with EcoRI and subjected to Southern blot analysis using a probe specific for MATα sequence (Left panel). The percentage of I-type chromosomes were calculated by measuring the intensity of A- and I-type bands and presented below the blot. Right panel: schematics of MAT-containing chromosomes with the indicated genotype and predicted fragment sizes for the probe (purple) in Southern blot analysis. (b and c) Genomic DNA was prepared from strains with the indicated genotype (HPH1047, HPH1050, HPH1201, HPK011, HPK084, HPK085, HPK092, and HPK093), and the mating type was determined by MAT PCR analysis as shown in Fig. 1c. +N: cells grown in YPDS medium, −N: cells incubated in MEMA medium for 16 hrs. CDC28-specific primer set was added to all PCR reactions as controls for the amount of input DNA. (d) MAT a IR2∆ haploid strain with ura3-1 ade12-cr3 genotype (HPH1174) and the same strain carrying pHM961 expressing α2 gene (HPH1702) were crossed with wild type strain (HPH22) on NaKG mating medium and incubated at 30 °C. Similarly, MATα IR2∆ haploid strain with ura3-1 leu1-1 genotype (HPH1162) and the same strain carrying pHM964 expressing a 1 gene (HPH1699) were crossed with wild type strain (BY4331). After 24 h, cells were spread on SD + Ura plates to select for Leu+Ade+ diploids. Colony number was counted after 2-days incubation at 37 °C. The average of three independent matings is shown. Error bars indicate SD. Full-length blot and gels are presented in Supplementary Figure 5.
Figure 3
Figure 3
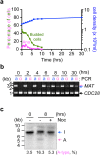
Mating type switching occurs after cessation of cell division under starvation condition. (a) Wild type CBS4329 cells were grown in YPDS medium and transferred to NaKG medium. Samples were collected at different intervals and cell density was measured using a hematocytometer. The remaining of samples were fixed and stained with DAPI to determine anaphase cells (Ana, indicated by magenta) and budding index (Budded cells, indicated by green). (b) Genomic DNA was prepared from samples collected in (a) and subjected to MAT PCR analysis as shown in Fig. 1c. CDC28-specific primers were added to PCR reactions as controls for the amount of input DNA. (c) I(a)-type of CBS4329 cells grown in YPDS medium were incubated in NaKG medium containing either dimethyl sulfoxide or nocodazole for 8 hrs. Genomic DNA samples were prepared and digested with EcoRI and subjected to Southern blot analysis using the probe specific for MATα sequences shown in Fig. 2a. The percentage of A-type chromosomes was calculated by measuring the intensity of A- and I-type bands and presented below the blot. Full-length gels are presented in Supplementary Figure S5.
Figure 4
Figure 4
The pheromone signalling pathway is not required for the MAT inversion. (a) Ste4∆ cells and ste4∆ cells carrying the STE4 plasmid (HPH1268 and HPH1267, respectively) grown in YPDS medium were incubated in NaKG medium for 12 hrs. Genomic DNA was subjected to MAT PCR analysis as shown in Fig. 1c. CDC28-specific primers were added to PCR reactions as controls for the amount of input DNA. (b) STE2 STE3 ku80∆ (HPH1379) and ste2ste3ku80∆ cells (HPH1696) grown in YPDS medium were incubated in NaKG medium for 12 hrs. Genomic DNA was subjected to MAT PCR analysis as shown in Fig. 1c. CDC28-specific primers were added to PCR reactions as controls for the amount of input DNA. Full-length gels are presented in Supplementary Figure S5.
Figure 5
Figure 5
Rme1 is required for mating and MAT inversion. (a) RME1 mRNA level increases in response to nutritional starvation. The qPCR analysis was performed with RNAs prepared from wild-type cells grown in YPDS and from the same cells following incubation in NaKG medium. RNA levels were normalized to that of ACT1 RNA. Shown are the averages of three independent PCR reactions. Error bars indicate SD. (b) Mating is severely reduced in rme1∆ cells. Wild-type and rme1∆ strains with ura3-1 genotypes (HPH47 and HPK021, respectively) were combined with wild type cells with leu1-1 genotype (HPH22) on NaKG mating medium and incubated at 30 °C. After 30 h, cells were spread on SD plates to select for Leu+Ura+ diploids. Colony number was counted after 2-days incubation at 37 °C. The average of three independent matings is shown. Error bars indicate SD. (c) Wild type (BY21401) and rme1∆ (HPK187) were grown in YPDS medium and shifted to NaKG medium and incubated for 12 hrs. Cells were fixed with 70% ethanol and DNA content was measured by flowcytometry. (d) MAT inversion was reduced in rme1∆. Genomic DNA was prepared from strains with the indicated genotype (HPK161 and HPK163), digested with EcoRI, and subjected to Southern blot analysis as shown in Fig. 2a. +N: cells grown in YPDS medium, −N: incubated in NaKG medium for 15 hrs. Full-length gels are presented in Supplementary Figure S5.
Figure 6
Figure 6
RME1 overexpression induces the MAT inversion in mitotically growing cells. (a) RME1 was expressed in I(a)- and A(α)-type wild-type strains (CBS4329) using a strong constitutive TEF1 promoter. Cells were grown in SD medium supplemented with adenine, leucine, and uracil, and genomic DNA was subjected to MAT PCR analysis as shown in Fig. 1c. (b) A(α)-type wild-type cells carrying PTEF1-RME1 were grown in SD medium (+N), transferred to NaKG medium and incubated for 20 hrs (−N). Genomic DNA was subjected to MAT PCR analysis as shown in Fig. 1c. CDC28-specific primers were included in the reaction as control for input DNA. RME1 -: cells carrying vector (pHM874), OP: cells carrying PTEF1-RME1 (pHM960). (c) Wild-type cells carrying vector (pHM874) or PTEF1-RME1 (pHM960) (OPT1 and OPT2, respectively) were grown on SD plate supplemented with adenine, leucine, and uracil for 3 days at 30 °C. Cells were fixed with ethanol and stained with DAPI. Mating projection-like morphology (orange arrows) and meiotic nuclei (yellow arrow) were evident only in cells carrying PTEF1-RME1. (d) I(a)-type wild type cells (HPH466) carrying either vector (pHM874) or PTEF1-RME1 (pHM960) were grown in SD medium supplemented with adenine, leucine, and uracil or YPDS medium. Genomic DNA was subjected to MAT PCR analysis as shown in Fig. 1c. CDC28-specific primers were included in the reaction as control for input DNA. Full-length gels are presented in Supplementary Figure S5.
Figure 7
Figure 7
MAT inversion is autophagy dependent. (a) Autophagy mutants are MAT inversion deficient. Wild-type, atg1∆, and atg13∆ cells (HPH848, HPH1561, and HPH1556, respectively) were grown in YPDS medium (+N), transferred to MEMA medium and incubated for 15 hrs (−N). Genomic DNA was subjected to MAT PCR analysis as shown in Fig. 1c. (b) Atg1 is dispensable for REM1-induced MAT inversion. Wild-type (BY2140) and atg1∆ cells (HPH1620) carrying either vector (pHM874) or PTEF1-RME1 (pHM960) were grown in YPDS or SD medium supplemented with adenine, leucine, and uracil. Genomic DNA was prepared and subjected to MAT PCR analysis as shown in Fig. 1c. CDC28-specific primers were included in the reaction as control for input DNA. Full-length gels are presented in Supplementary Figure S5.
Figure 8
Figure 8
a1-α2 functions independently of RME1 expression. (a) a1-α2 does not repress RME1 mRNA levels. A(α)-type haploid cells and I(a)-type haploid cells in the presence or absence of MATα the exogenous URA3 locus (HPH1309, HPH1311, and HPK007, respectively) were grown in YPDS (+N), then shifted to MEMA medium and incubated for 10 hrs (−N). RNA was prepared and subjected to RNA-seq analysis. Relative amount of RME1 RNA is shown. (b) RME1-5flag cells (HPK121) were grown in YPDS (0 hr) following incubation in MEMA medium for the indicated time. Total protein was prepared and Rme1-5flag protein was detected by western blotting using an anti-flag M2 antibody. An anti-actin antibody was used as a loading control. (c) Model of the regulation of the mating type switching and mating in O. polymorpha. Full-length blots are presented in Supplementary Figure S5.

Similar articles

Cited by

References

    1. Haber JE. Mating-type genes and MAT switching in Saccharomyces cerevisiae. Genetics. 2012;191:33–64. doi: 10.1534/genetics.111.134577. - DOI - PMC - PubMed
    1. Herskowitz I. A regulatory hierarchy for cell specialization in yeast. Nature. 1989;342:749–757. doi: 10.1038/342749a0. - DOI - PubMed
    1. Butler G, et al. Evolution of the MAT locus and its Ho endonuclease in yeast species. Proceedings of the National Academy of Sciences. 2004;101:1632–1637. doi: 10.1073/pnas.0304170101. - DOI - PMC - PubMed
    1. Herman A, Roman H. Allele specific determinants of homothallism in Saccharomyces lactis. Genetics. 1966;53:727–740. - PMC - PubMed
    1. Rajaei N, Chiruvella KK, Lin F, Aström SU. Domesticated transposase Kat1 and its fossil imprints induce sexual differentiation in yeast. Proc. Natl. Acad. Sci. USA. 2014;111:15491–15496. doi: 10.1073/pnas.1406027111. - DOI - PMC - PubMed

Publication types

MeSH terms