. 2018 Jan;15(1):73-80.
doi: 10.1038/nmeth.4511. Epub 2017 Nov 27.

A permanent window for the murine lung enables high-resolution imaging of cancer metastasis

Affiliations

A permanent window for the murine lung enables high-resolution imaging of cancer metastasis

David Entenberg et al. Nat Methods. 2018 Jan.

Abstract

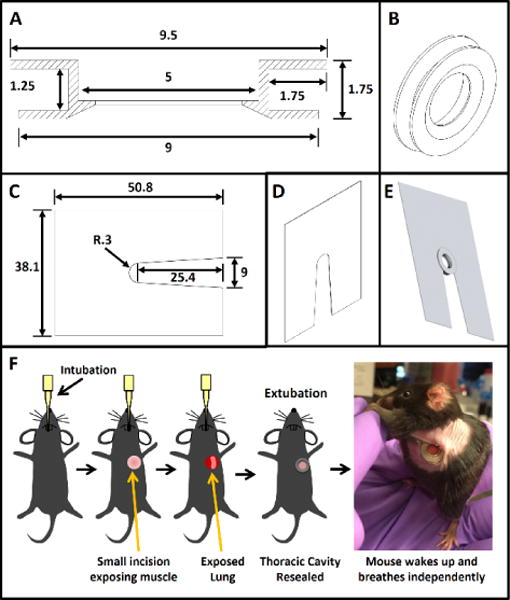
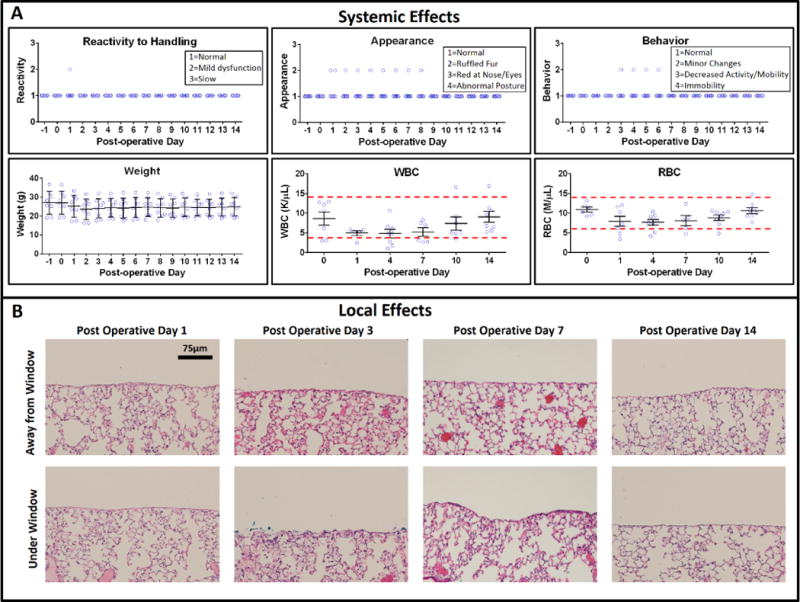
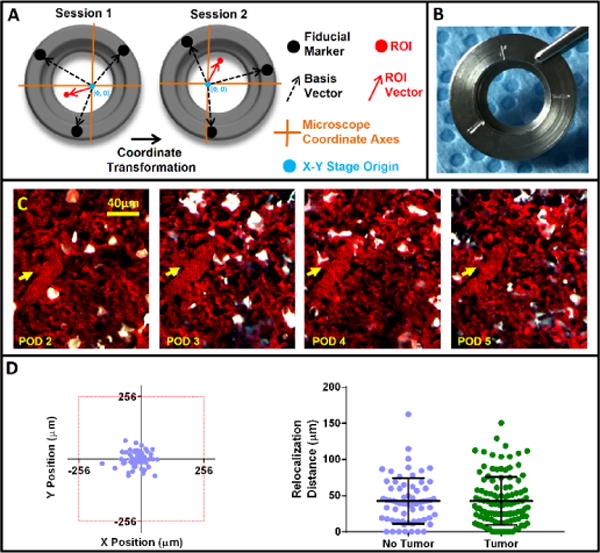
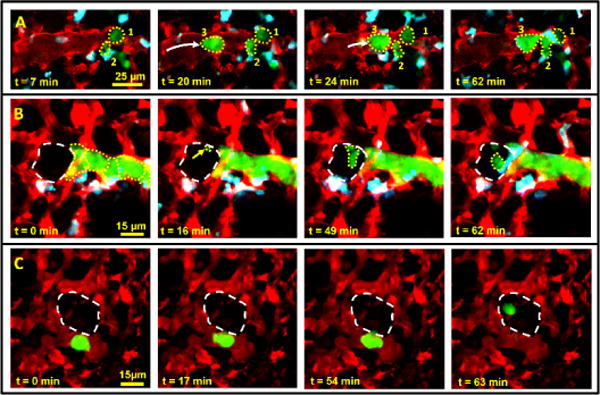
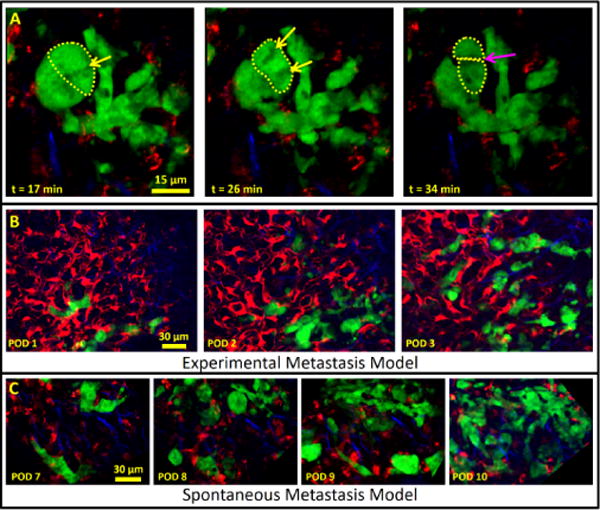
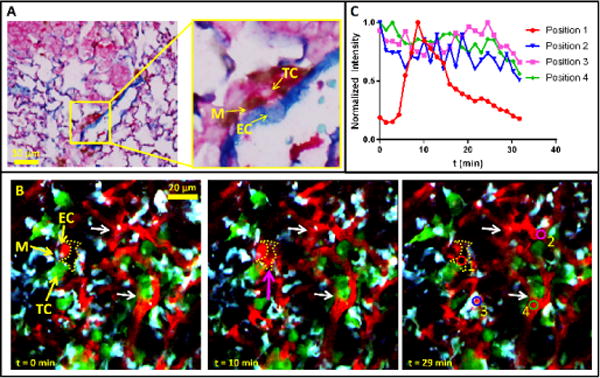
Stable, high-resolution intravital imaging of the lung has become possible through the utilization of vacuum-stabilized imaging windows. However, this technique is extremely invasive and limited to only hours in duration. Here we describe a minimally invasive, permanently implantable window for high-resolution intravital imaging of the murine lung that allows the mouse to survive surgery, recover from anesthesia, and breathe independently. Compared to vacuum-stabilized windows, this window produces the same high-quality images without vacuum-induced artifacts; it is also less invasive, which allows imaging of the same lung tissue over a period of weeks. We further adapt the technique of microcartography for reliable relocalization of the same cells longitudinally. Using commonly employed experimental, as well as more clinically relevant, spontaneous metastasis models, we visualize all stages of metastatic seeding, including: tumor cell arrival; extravasation; growth and progression to micrometastases; as well as tumor microenvironment of metastasis function, the hallmark of hematogenous dissemination of tumor cells.


Conflict of interest statement

Competing Financial Interests

The authors declare competing financial interests: details are available in the online version of the paper.

Figures

Figure 1
Figure 1
Design of WHRIL and overview of surgical protocol. (a) Computer-aided design of the window frame. All dimensions are listed in millimeters. (b) 3D view of the window frame that shows the beveled, lung-facing side. (c) Computer-aided design of the window-fixturing plate. All dimensions are listed in millimeters. Plate is made of 0.008 in stainless steel shim stock. (d) 3D view of the window-fixturing plate. (e) 3D rendering of the window inserted into the fixturing plate. (f) Overview of the surgical protocol.
Figure 2
Figure 2
Validation of local and systemic effects of the WHRIL. (a) Systemic effects: six metrics of health were measured over 2 weeks for WHRIL-bearing animals (n = 8). These metrics include measures of the reactivity to handling, physical appearance of the mouse (ruffled fur, posture, etc.), weight, behavior (activity level), and counts of white and red blood cells. Center line and whiskers mark the mean ± s.e.m. (b) Local effects: histological sections stained with H&E, both under and far away from the window.
Figure 3
Figure 3
Microcartography enables relocalization of positions within the window day after day. (a) Easily identifiable fiducial marks etched on the window frame (black dots) serve as navigational reference points and, along with the xy stage origin (blue dots), form a set of basis vectors (dashed black arrows) from which a coordinate transformation connecting each imaging session can be derived. This transformation takes into account both rotation and translation of xy stage coordinate axes (orange lines) relative to the mouse from session to session. The derived transformation can then be used to predict the coordinates of any previously measured location (red dot). (b) Picture of the window with etched fiducial marks. (c) Multiphoton images of a single optical section in the lung that show the same microvasculature relocated using microcartography over 4 d (consecutive days). Yellow arrows indicate the location of same microvessel branch point each day. (d) Reproducibility of microcartography. Left: scatter plot (n = 65 fields of view) showing the ability of microcartography to relocalize a region of interest to within a single 512 × 512 μm field of view (red box). Right, graph showing the precision of microcartography’s ability to relocate a region of interest in both healthy (purple, n = 65 fields of view; mean = 42.7 ± 31.4 μm s.e.m) and tumor-bearing lung tissue (green, n = 113 fields of view; mean = 42.8 ± 33.3 μm s.e.m).
Figure 4
Figure 4
The WHRIL allows visualization of tumor cell arrival (a) and extravasation in both experimental (b) and spontaneous (c) metastasis models. (a) Stills from a time-lapse video that show individual tumor cells (numbers 1, 2 and 3; dotted yellow outlines) arriving in the lung vasculature after intravenous injection. The frame at t = 7 min shows two tumor cells residing in the vasculature. At 20 min, a third tumor cell arrives. By 62 min, the three cells form a cluster in the vasculature. (b) Stills from a time-lapse intravital imaging video of experimentally metastasized (tail-vein injected) tumor cells (dotted yellow outlines) lodged in the vasculature ~60 min after tail-vein injection. 16 min after the start of imaging, an invasive protrusion (yellow arrow and small dotted outline) can be seen crossing the endothelium into the alveolus (large dashed white outline). Extravasation of the tumor cell has completed by t = 62 min. Images are a z projection of three optical sections taken 3 μm apart and processed with the blood-averaging algorithm so as to better determine the boundaries of the vasculature. Raw image data from a single optical section are shown in supplementary Figure 5a and supplementary Video 5. (c) Stills from a time-lapse intravital imaging video of a spontaneously metastasizing tumor cell in the vasculature 1 d after window implantation. The cell crosses the endothelium into the alveolar space (dashed white outline) by t = 63 min. Images are a z projection of two optical sections taken 3 μm apart and processed with the blood-averaging algorithm so as to better determine the boundaries of the vasculature. Image data without blood averaging from a single optical section are shown in supplementary Figure 5c.
Figure 5
Figure 5
The WHRIL allows visualization of subcellular structures and tumor cell growth over several days in either experimental or spontaneous metastasis models. (a) Visualization of apparent tumor cell division in a spontaneous metastasis model. Stills from a time-lapse video show a cluster of tumor cells 2 d after arrival into the lung vasculature and 8 d after implantation of the WHRIL. In one cell (dashed yellow line in t = 17 min and t = 26 min), subcellular organelles can be seen undergoing movement characteristic of chromosomal alignment (yellow arrow at t = 17 min) and separation (yellow arrows at t = 28 min) followed by apparent cytokinesis (dashed yellow lines and magenta arrow at t = 34 min). (b) Visualization of growth in an experimental metastasis model: E0771–GFP tumor cells intravenously injected 1 d after implantation of the WHRIL are visualized over 3 d (consecutive days) as they grow from small collections of single cells to micrometastases. Green, GFP; red, Ve-Cad labeled endothelia and 155 kD TMR dextran; blue, SHG from collagen I fibers. Verification that the same field of view is visualized each day can be accomplished by examination of the vascular morphology in this image or just the collagen I morphology, which is shown in supplementary Figure 7a. (c) Visualization of growth in a spontaneous metastasis model. Tumor cells that have disseminated spontaneously from an orthotopic primary mammary tumor are also followed over multiple consecutive days. Images showing the growth of a newly arrived group of tumor cells taken on 3 d (consecutive days) showing the progression to a micrometastasis. Verification that the same field of view is visualized each day can be accomplished by examination of the vascular morphology in this image or just the collagen I morphology, which is shown in supplementary Figure 7b. Green, GFP; red, Ve-Cad labeled endothelia and 155-kD TMR dextran; blue, SHG from collagen I fibers.
Figure 6
Figure 6
Visualization of TMEM in the lung. (a) TMEM structures can be observed in histological sections of breast cancer metastases in the lung. The yellow box indicates one TMEM, which is magnified in the right panel to show the three constituent cells of TMEM. M, macrophage (brown); TC, tumor cell (pink); EC, endothelial cell (blue). (b) The WHRIL allows visualization of TMEM function in vivo. Stills from a time-lapse video in a lung metastasis 2.4 weeks after tail-vein injection of tumor cells and 2 d post-WHRIL implantation show TMEM, consisting of a TC, M and EC in direct contact. In mammary tumors, functional TMEM are the sites of transient vascular permeability and location of intravasation and hematogenous dissemination of tumor cells. Direct visualization of transient vascular leakage of TMR-labeled 155 kD dextran (red) from the serum into the interstitium at t = 10 min (magenta arrow, dotted yellow area) indicates the adjacent TMEM is functional. Red, TMR-labeled 155 kD dextran; green, E0771–GFP tumor cells; cyan, CFP-labeled macrophages. Colored circles in time t = 29-min panel show spatial locations used for quantification of dextran signal in panel c. (c) Quantification of leaked extravascular dextran signal and comparison to vascular dextran signal. 40-μm2 colored circles in panel b at t = 29 min indicate the locations of quantification of dextran signal. The red circle measures the transient extravascular dextran signal that comes from the TMEM, while the other three circles measure the vascular signal over time at different locations across the tissue. All signals were normalized to their peak values.

Comment in

References

    1. Looney MR, et al. Stabilized imaging of immune surveillance in the mouse lung. Nat Methods. 2011;8:91–96. - PMC - PubMed
    1. Entenberg D, et al. In vivo subcellular resolution optical imaging in the lung reveals early metastatic proliferation and motility. Intravital. 2015;4:1–11. - PMC - PubMed
    1. Martin EA. Concise Medical Dictionary. Oxford University Press; 2010.
    1. Vinegoni C, Lee S, Feruglio PF, Weissleder R. Advanced motion compensation methods for intravital optical microscopy. IEEE J Sel Top Quantum Electron. 2014;20:115–121. - PMC - PubMed
    1. Presson RG, Jr, et al. Two-photon imaging within the murine thorax without respiratory and cardiac motion artifact. Am J Pathol. 2011;179:75–82. - PMC - PubMed

Publication types