. 2017 Nov 24;8(1):1779.
doi: 10.1038/s41467-017-01856-y.

Quenching protein dynamics interferes with HIV capsid maturation

Affiliations

Quenching protein dynamics interferes with HIV capsid maturation

Mingzhang Wang et al. Nat Commun. .

Abstract

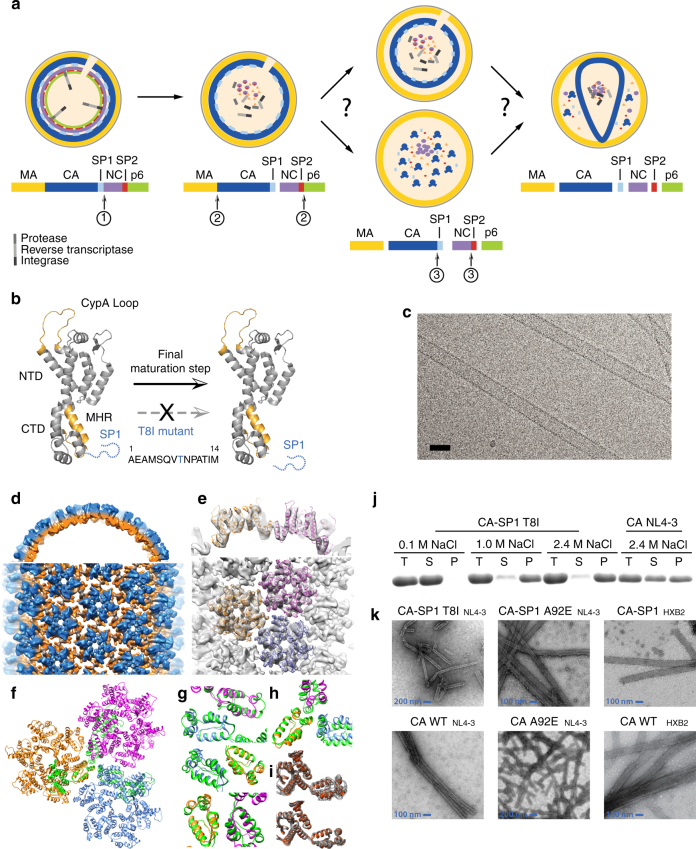
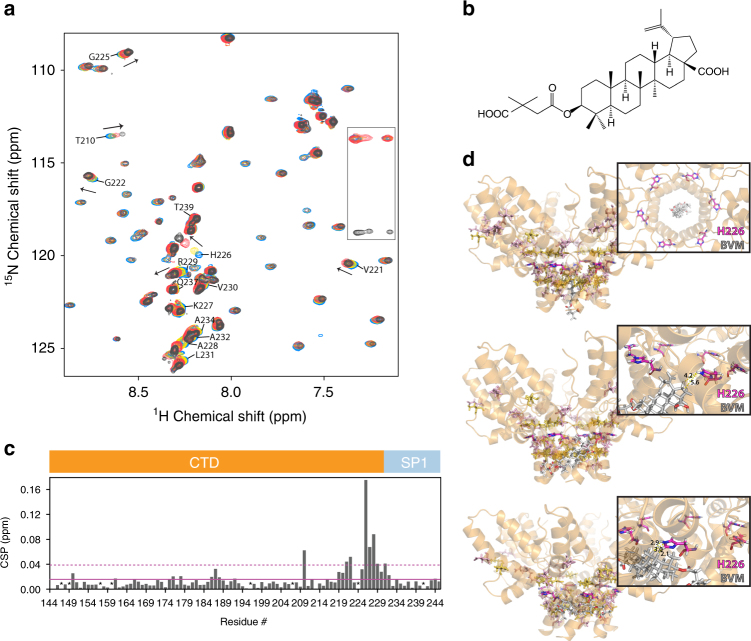
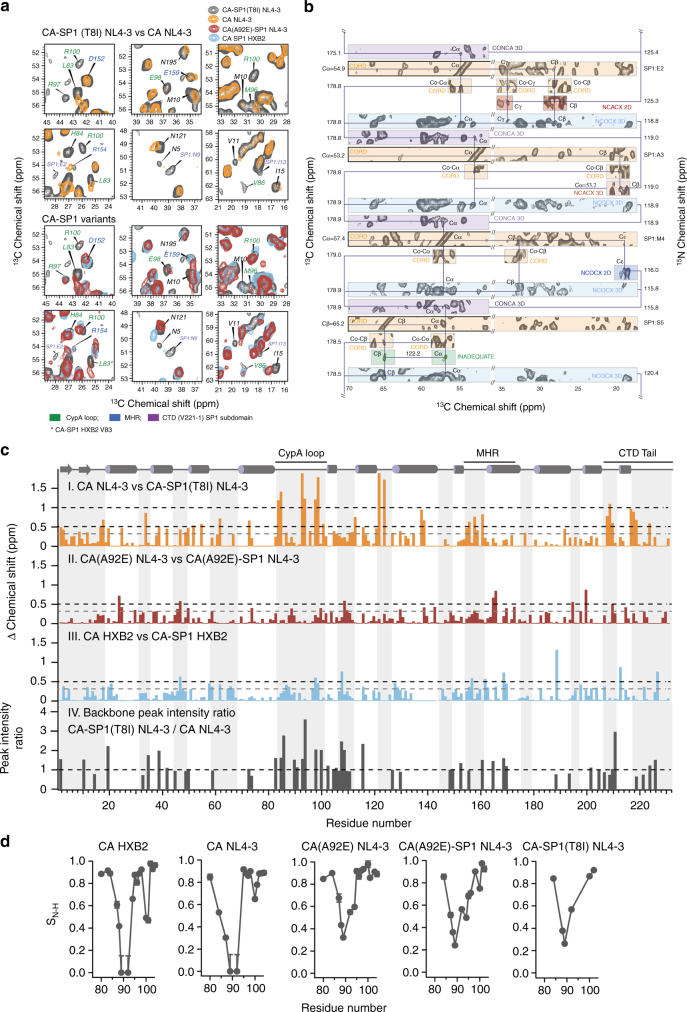
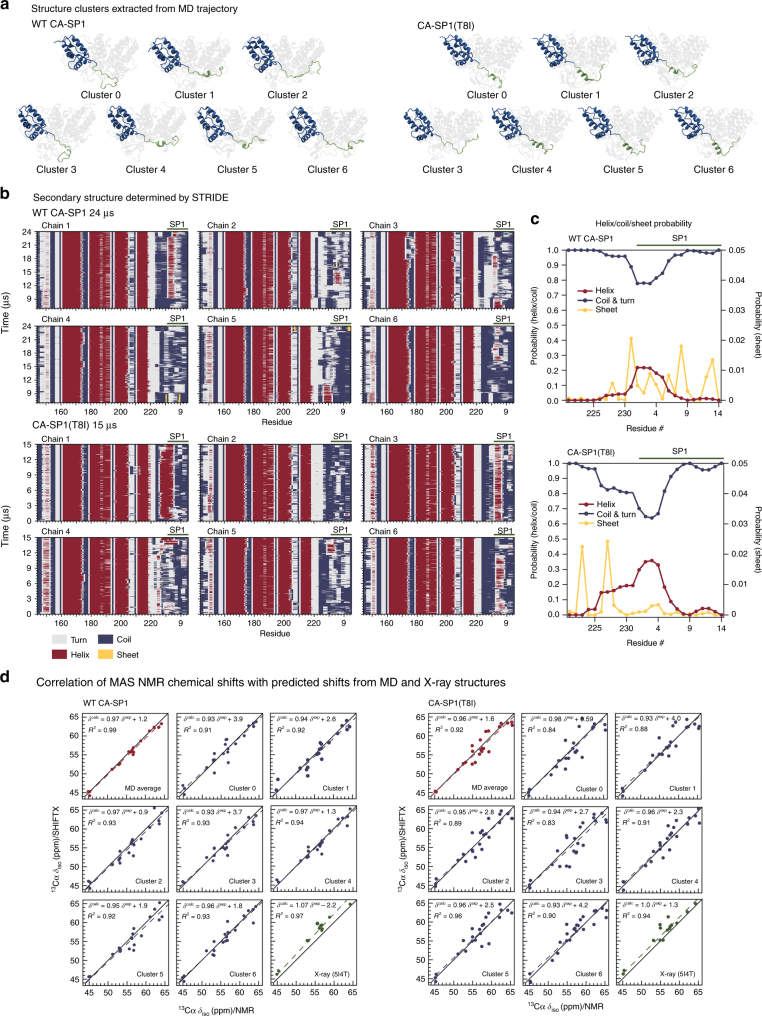
Maturation of HIV-1 particles encompasses a complex morphological transformation of Gag via an orchestrated series of proteolytic cleavage events. A longstanding question concerns the structure of the C-terminal region of CA and the peptide SP1 (CA-SP1), which represents an intermediate during maturation of the HIV-1 virus. By integrating NMR, cryo-EM, and molecular dynamics simulations, we show that in CA-SP1 tubes assembled in vitro, which represent the features of an intermediate assembly state during maturation, the SP1 peptide exists in a dynamic helix-coil equilibrium, and that the addition of the maturation inhibitors Bevirimat and DFH-055 causes stabilization of a helical form of SP1. Moreover, the maturation-arresting SP1 mutation T8I also induces helical structure in SP1 and further global dynamical and conformational changes in CA. Overall, our results show that dynamics of CA and SP1 are critical for orderly HIV-1 maturation and that small molecules can inhibit maturation by perturbing molecular motions.


Conflict of interest statement

The authors declare no competing financial interests.

Figures

Fig. 1
Fig. 1
a Schematic diagram of the HIV-1 Gag sequential cleavage and virus maturation process. RNA was omitted for clarity. b CA–SP1 cleavage. The ribbon diagram of the CA monomer is shown with the CypA loop and MHR highlighted in orange and the SP1 region depicted as a dotted blue line. The T8I mutation in SP1 mimics the presence of maturation inhibitors (MI) in abolishing SP1 cleavage. c A cryo-EM image of CA–SP1 tubular assemblies. Scale bar, 50 nm. dh Cryo-EM reconstruction of CA–SP1 assemblies. d Surface rendering of the of CA–SP1 3D density map, low-pass filtered to 8 Å resolution. The density map (contoured at 2σ) is colored in orange and blue for CA–CTD and CA–NTD, respectively, viewed along (top) and perpendicular to (bottom) the tube axis. e MDFF fitting of three CA hexamers (PDB code 4XFX, gold, magenta, and blue ribbons) into the density map. f Superposition of the ribbon diagrams of three CA molecules at the trimer interface (green, PDB code 3j34) onto the equivalent model for the CA–SP1 trimer interface (gold, magenta, and blue). g, h Comparison of the dimer (g) and trimer (h) interfaces in CA assemblies (green) to those in CA–SP1 assemblies (gold, magenta, blue). i The variabilities among the six CA molecules in CA (top) and CA–SP1 (bottom) assemblies. j Assembly assay of CA–SP1(T8I) NL4-3 and CA NL4-3 for different concentrations of NaCl. k TEM images of tubular assemblies of CA(A92E) and CA(A92E)–SP1 variants
Fig. 2
Fig. 2
Solution NMR and rigid body docking of Bevirimat binding to CTD–SP1. a Superposition of selected region of the 1H-15N HSQC spectra of 0.4 mM CTD–SP1 in the absence (blue) and presence of 1.11 mM (yellow), 2.22 mM (red), and 3.33 mM (black) Bevirimat at 298 K. Representative CTD–SP1 resonances are labeled with residue names and numbers. Folded arginine side chain Nε resonances are enclosed in the rectangle. b 1H,15N-combined chemical shift perturbations (CSP)  for CTD–SP1 resonances in the absence and presence of Bevirimat (3.33 mM), respectively. The solid and dashed horizontal lines indicate the average chemical shift change (0.016 ppm) and the sum (0.038 ppm) of the average change plus one S.D., respectively. Proline residues and the unassigned S149 positions are marked with *. Note the large CSPs observed for resonances of residues 219–233 are indicative of the interaction between Bevirimat and CTD–SP1. c Chemical structure of Bevirimat. d Binding poses of BVM (gray) in the CTD–SP1 hexamer (X-ray structure PDB code 5I4T) resulting from rigid body docking. The insets are expansions, illustrating the relative positioning of BVM and the H226 residue (colored magenta). Residues with CSPs > 0.04 and >0.02 ppm are colored yellow and light pink, respectively. Residues in the CTD–SP1 junction whose resonances experience CSPs > 0.02 ppm are located in the binding interface identified in the docking studies
Fig. 3
Fig. 3
MAS NMR data for CA–SP1 assemblies. a Expansions of the superposition of 2D13C-13C correlation spectra for CA and CA–SP1 variants highlighting SP1 resonances and residues exhibiting chemical shift or peak intensity changes. Chemical shift perturbations are present for resonances of several residues in the CTD–SP1 tail (V221-to end), CypA loop, MHR, and NTD β-hairpin. Top: CA NL4-3 (orange) and CA–SP1(T8I) NL4-3 (gray). Bottom: CA(A92E)–SP1 NL4-3 (red), CA–SP1 HXB2 (blue), and CA–SP1(T8I) NL4-3 (gray). b Sequential assignment walk for a stretch of CA–SP1(T8I) residues (SP1 residues E2–S5). Note the large intensity of the associated resonances, indicative of reduced dynamics. Their chemical shifts are consistent with increased helicity, compared  to WT CA–SP1. c Chemical shift changes between CA and CA–SP1 plotted along the linear amino-acid sequence. I, II, III: sum of 13Cα,15N chemical shift perturbations (CSP): CA NL4-3 and CA–SP1(T8I) NL4-3 (orange), CA(A92E) NL4-3 and CA(A92E)–SP1 NL4-3 (brown), CA HXB2, and CA–SP1 HXB2 (blue). Significant CSPs of >0.5 ppm are observed for the CypA loop, the MHR region, and the CTD tail. CSP values < 0.3 ppm (dashed gray) are negligible and within experimental and systematic error. IV: Plot of the 13Cα-15N backbone peak intensity ratio (CA–SP1(T8I) NL4-3/CA NL4-3; gray) vs. residue number (for non-overlapping peaks with resonance assignments in the 2D NCA MAS NMR spectra). Residues with a peak intensity ratio >1 possess attenuated motions on micro- to millisecond timescales. d Sequence dependence of CypA loop dynamics for five different HIV-1 CA and CA–SP1 variants. 1H-15N dipolar order parameters are plotted vs. residue number for CypA loop residues in CA HXB2, CA NL4-3, CA(A92E) NL4-3, CA(A92E)–SP1 NL4-3, and CA–SP1(T8I) NL4-3. The CA–SP1(T8I) mutant exhibits the same order of magnitude attenuation of loop dynamics as previously observed in the CA(A92E) escape mutant
Fig. 4
Fig. 4
MD simulations of the CTD–SP1 hexamer. a Clustering analysis of the MD trajectory of CA–SP1 WT (left) and CA–SP1(T8I) mutant (right) identified six major sub-populations. One chain is colored in blue (CA–CTD) and green (SP1) to illustrate the differences in secondary structure present in the SP1 region: predominantly random coil in CA–SP1 WT and significantly increased helical content in CA–SP1(T8I). b Stride plots of secondary structure for each chain along with the MD trajectories for CA CTD–SP1 WT (top), and CA CTD–SP1(T8I) mutant (bottom). c Helix/coil probability of the CTD tail (V221-end)SP1 subdomain averaged over the MD trajectories: CTD–SP1 WT (top) and CTD–SP1(T8I) (bottom). The expanded scale (0–0.05; right hand side) is shown for the “Sheet” content. b, c The CTD tail (V221-end)SP1 region exhibits a dynamic equilibrium between random coil and helical conformations in CA CTD–SP1 WT, whereas in the CA CTD–SP1(T8I) mutant the dynamics are greatly attenuated and the helical content is increased. d Correlation of MAS NMR chemical shifts and SHIFTX2-predicted shifts from the MD trajectory seeded from the X-ray structure (PDB: 5I4T): CTD–SP1 WT (left) and CTD–SP1(T8I) (right). Note the remarkable agreement between the experimental and predicted shifts, indicating that the MD simulations accurately capture the conformational equilibrium in the assembled CA–SP1

References

    1. Freed EO. HIV-1 assembly, release and maturation. Nat. Rev. Microbiol. 2015;13:484–496. doi: 10.1038/nrmicro3490. - DOI - PMC - PubMed
    1. Ganser BK, Li S, Klishko VY, Finch JT, Sundquist WI. Assembly and analysis of conical models for the HIV-1 core. Science. 1999;283:80–83. doi: 10.1126/science.283.5398.80. - DOI - PubMed
    1. Li S, Hill CP, Sundquist WI, Finch JT. Image reconstructions of helical assemblies of the HIV-1CA protein. Nature. 2000;407:409–413. doi: 10.1038/35030177. - DOI - PubMed
    1. Zhao GP, et al. Mature HIV-1 capsid structure by cryo-electron microscopy and all-atom molecular dynamics. Nature. 2013;497:643–646. doi: 10.1038/nature12162. - DOI - PMC - PubMed
    1. Gres AT, et al. X-ray crystal structures of native HIV-1 capsid protein reveal conformational variability. Science. 2015;349:99–103. doi: 10.1126/science.aaa5936. - DOI - PMC - PubMed

Publication types