. 2017 Nov 24;8(1):1852.
doi: 10.1038/s41467-017-01600-6.

STIM1 promotes migration, phagosomal maturation and antigen cross-presentation in dendritic cells

Affiliations

STIM1 promotes migration, phagosomal maturation and antigen cross-presentation in dendritic cells

Paula Nunes-Hasler et al. Nat Commun. .

Abstract

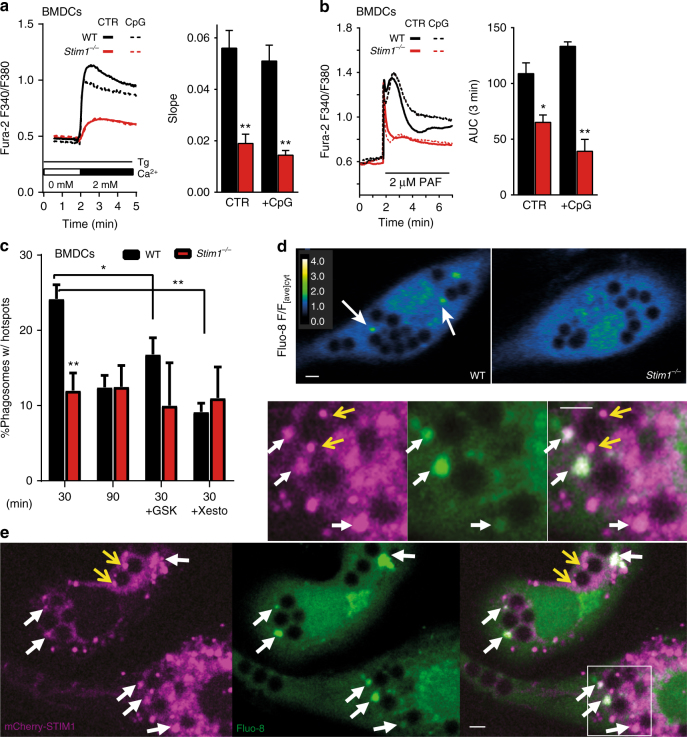
Antigen cross-presentation by dendritic cells (DC) stimulates cytotoxic T cell activation to promote immunity to intracellular pathogens, viruses and cancer. Phagocytosed antigens generate potent T cell responses, but the signalling and trafficking pathways regulating their cross-presentation are unclear. Here, we show that ablation of the store-operated-Ca2+-entry regulator STIM1 in mouse myeloid cells impairs cross-presentation and DC migration in vivo and in vitro. Stim1 ablation reduces Ca2+ signals, cross-presentation, and chemotaxis in mouse bone-marrow-derived DCs without altering cell differentiation, maturation or phagocytic capacity. Phagosomal pH homoeostasis and ROS production are unaffected by STIM1 deficiency, but phagosomal proteolysis and leucyl aminopeptidase activity, IRAP recruitment, as well as fusion of phagosomes with endosomes and lysosomes are all impaired. These data suggest that STIM1-dependent Ca2+ signalling promotes the delivery of endolysosomal enzymes to phagosomes to enable efficient cross-presentation.


Conflict of interest statement

The authors have no competing financial interests.

Figures

Fig. 1
Fig. 1
STIM1 promotes cross-presentation in vivo and in vitro. a Representative flow cytometry gating strategy of cells isolated from draining (DL) and non-draining (NDL) lymph nodes of mice injected with 1.0 or 0.5% OVA-coated beads (OVAb), and with 1 × 106 CD45.1+ OT-I cells. Out of 50,000 CD8α+ cells, the total number of CD45.1+ OT-I cells and their corresponding CFSE fluorescence were analysed. b OT-I cells were strongly decreased in DL but not NDL of CD45.2+ LysM-Cre; Stim1 fl/fl mice as compared to Stim1 fl/fl littermates (upper graph). Similarly, OT-I proliferation, as assessed by CFSE dilution, was significantly decreased in STIM1-deficient mice (lower graph). N = 3 pairs of mice. c Cross-presentation of OVA antigens to OT-I cells by BMDCs exposed to OVAb (4 h) was quantified as the BrDU incorporation after 72 h of co-culture. Stim1 ablation reduced cross-presentation in vitro, both in immature BMDCs and in cells matured with 1 μg mL−1 LPS or 0.1 μM CpG, at varying OT-I:BMDC (T:DC) ratios. N = 3, in triplicate wells. Ratio 1:1 T:DC in unstimulated WT cells = 1. d Pre-incubation with 40 μM BAPTA-AM or 1 μM Xesto reduced cross-presentation, similar to known inhibitors 0.2 nM ConcA or 10 μM DPI, applied as positive controls. N = 3, in triplicate wells. Control DMSO condition = 1. e Incubation with varying doses of the OVA(257–264) fragment SIINFEKL (1 h) induced similar levels of cross-presentation in WT and STIM1-deficient BMDCs. N = 3, in triplicate wells. f Reduced cross-presentation was also observed in DC2114 + shSTIM1, as compared to control (+shCTR) as assessed with BrDU. Phagocytic targets added at 20:1 targets:cells. N = 3, in triplicate wells. Error bars are means ± SEM, p* < 0.5, **p < 0.1, ***p < 0.01 using a two-way ANOVA and Sidak’s post test for b, c and e, and a Student’s t-test for d and f
Fig. 2
Fig. 2
STIM1 promotes Ca2+-dependent migration in vivo and in vitro. a CD45.1 congenic wild-type hosts were injected with a mixture of 1 × 106 wild-type GFP+ (WT-GFP), 1 × 106 Stim1 −/− BMDCs and 0.5% OVAb. DL were isolated and the relative percentage of WT:Stim1 −/− (CD11c+, CD45.2+) cells analysed by flow cytometry. Full gating strategy is shown in Supplementary Fig. 2a. The proportion of Stim1 −/− cells was significantly reduced 24 h but not 48 h after injection. N = 4 pairs of mice. b A 24 h transwell migration assay revealed 40–65% increases in migration towards fMIFL, SDF-1 and CCL21 chemoattractants in WT cells. Stim1 −/− BMDC showed reduced migration towards fMIFL and SDF-1 but not CCL21 (all applied at 10−6M) as compared to WT. Full gating strategy is shown in Supplementary Fig. 2b. N = 3 in triplicate wells. c Ca2+ transients induced by acute exposure (arrows) of chemoattractants, as measured using Fura-2 (traces representative average of 14–22 cells). Quantification of the area under the curve (AUC) of the first 2 min after chemoattractant addition (right bottom panel) revealed significantly lower Ca2+ entry in Stim1 −/− BMDCs in response to fMIFL and SDF-1, while no Ca2+ entry in response to CCL21 was detected for either genotype. N = 4 (coverslips each) containing: 68/66/72 (WT) or 47/56/52 (Stim1 −/−) cells for fMIFL/SDF-1/CCL21. Error bars are means + SEM, *p < 0.5, **p < 0.1 using a two-way ANOVA and Sidak’s post test for a and a Student’s t-test for b and c
Fig. 3
Fig. 3
STIM1 localizes near phagosomes and promotes global and local Ca2+ signals in BMDCs. a, b Stim1 ablation strongly decreased SOCE in immature and CpG-matured BMDCs, measured as the slope of Ca2+-re-entry after store depletion with 1 μM Tg in Ca2+-free medium and 2 mM Ca2+ re-addition a, or as the area under the curve (AUC) of the first 3 min after acute exposure to the agonist PAF (2 μM, b). Traces are averages of 11–23 cells. N = 10/6; 3/4 (coverslips each) containing 129/119; 26/70 (WT) or 139/98; 67/97 (Stim1 −/−) cells for Tg: CTR/CpG; PAF: CTR/CpG. c, d Localized Ca2+ signalling near phagosomes (green dots, arrows, d) was measured in BMDCs loaded with 4 μM Fluo-8 and 2.5 μM BAPTA after 30 min or 90 min of exposure to targets, and in the absence or presence of 10 μM GSK or 1 μM Xesto after 30 min (c). Stim1 ablation reduced periphagosomal Ca2+ hotspots at 30 but not 90 min, and both GSK and Xesto reduced hotspot frequency in WT but not Stim1 −/− cells (c). N = 5/4;7/4;5/3;6/4 coverslips representing 870/794; 1916/1154; 898/814; 1124/1372 phagosomes; 196/178; 370/238; 270/265; 375/211 cells for WT/Stim1 −/− 30;90:30+GSK;30+Xesto. The colour-coded ratio images are Fluo-8 fluorescence/average cytosolic Fluo-8 fluorescence and show representative hotspots (d). e BMDCs transduced with mCherry-STIM1 (magenta) and loaded with Fluo-8 (green) as above display periphagosomal accumulations of STIM1 fluorescence that co-localize with Ca2+ hotspots (white arrows), as well as puncta that show no Ca2+ activity (yellow arrows). 20:1 target:cell ratio. Bars = 3 μm. Error bars are means + SEM, *p < 0.5, **p < 0.1 using a Student’s t-test
Fig. 4
Fig. 4
STIM1 promotes ER–Phagosome membrane contact sites. a 3D reconstruction (top left and middle) of FIB-SEM images (top right and bottom) shows that contiguous ER membranes (light blue) make multiple contact sites (coloured arrows and yellow highlight) with a single phagosome (purple). b The vicinity of contact sites (yellow highlight) is associated with an increased occurrence of bulges in the phagosome surface away from the beads, reminiscent of vesicular fission or fusion activity (arrows). c Quantification of FIB-SEM slices revealed that Stim1 ablation reduced the frequency of ER–Ph MCS (also called ER junctions). N = 55/26 slices representing a total of 170/35 phagosome cross-sections in WT/Stim1 −/− BMDCs respectively. OVAb added at 20:1 targets:cells, cells fixed 30 min after exposure to targets. Bar = 100 nm. Error bars are means + SEM, *p < 0.5, **p < 0.1 using a Student’s t-test
Fig. 5
Fig. 5
Stim1 ablation does not affect BMDC differentiation, maturation, or phagocytic rate. a BMDCs express CD11c, CD11b, low levels of F4/80 and MHC-I to similar extents regardless of STIM1 expression. N = 8/5/5 for CD11c/CD11b/F4/80. Values of cellular autofluorescence (−Ab) are shown for comparison. The gating strategy is shown in Supplementary Fig. 5a. b Expression of CD40, CD80, CD86 and MHC-II in immature cells or in cells matured with either CpG or LPS was similar in cells expressing or not STIM1. The full gating strategy is shown in Supplementary Fig. 2c. N = 7/5/3 for CTR/CpG/LPS for CD40/CD80, 8/5/7 for CD86 and 8/5/5 for MHC-II. c Phagocytosis of YG- Fluoresbrite-OVA-coated beads (OVAb) was decreased by loading cells with 40 μM BAPTA but not by exposing cells to the non-specific SOCE blocker LaCl3 (50 μM), and was similar in immature and mature STIM1-deficient cells as compared to cells from wild-type littermates. N = 4/5/3/3/3 for 30 min/4 h/24 h/BAPTA/La3+. The full gating strategy is shown in Supplementary Fig. 2c. d The absence of phagocytic defect in STIM1-deficient cells was confirmed by quantifying phagocytosis by microscopy. Phagocytic targets added at 20:1 targets:cells. N = 3. MFI = mean fluorescence intensity. Black bar = 3 μm. Error bars are means + SEM, *p < 0.5 using a Student’s t-test
Fig. 6
Fig. 6
Stim1 ablation does not affect ROS production or phagosomal pH. a Intracellular ROS production was measured in immature and CpG or LPS-matured BMDCs loaded with 30 μM DHE, and exposed to OVA-coated beads (OVAb), zymosan (Zym) or 100 nM PMA. N = 4, triplicate wells. b ROS production during phagocytosis (30 and 90 min) was assessed by exposing BMDCs to OVAb coupled to OxyBurst and Alexa-568. In a and b, DPI (10 μM) blocked the DHE or OxyBurst signal, but no differences were detected upon Stim1 ablation. N = 6/4/4 coverslips containing 84/54/58 (WT) or 85/50/53 (Stim1 −/−) cells, for 30 min/90 min/DPI. c, d Phagosomal acidification (30 and 90 min) was measured using ratiometric or pseudo-ratiometric imaging by exposing cells to FITC-coupled (c) and pHrodo/Alexa-488-coupled (d) OVA-coated zymosan, respectively. Phagosomal acidification was blocked by ConcA (0.2 nM), but there were no differences upon Stim1 ablation. N = 3 coverslips for all conditions, comprising 3218/2826/1713/3533 (WT) or 2722/5295/2608/4438 (Stim1 −/−) FITC-phagosomes, and 2612/2194/700/746 (WT) or 1740/2218/670/862 (Stim1 −/−) pHrodo phagosomes, for 30 min/90 min/30 min ConcA/90 min ConcA. e Histogram of all combined 90 min pHrodo phagosomal pH values for WT and Stim1 −/− BMDCs shows the broad and bimodal distribution of phagosomal pH in these cells. f Measurements of phagosomal pH by microscopy revealed the heterogeneity of the pH of individual phagosomes even within the same cell. Cells are outlined in white, the image is a merge of the brightfield and 480/440 colour-coded ratio channels 90 min after addition of FITC-OVA-zymosan. pH values obtained from calibration curves (Supplementary Fig. 6b) are matched to the ratio colour-coded bar. Phagocytic targets added at 20:1 targets:cells. White bar = 10 μm. Error bars are means ± SEM
Fig. 7
Fig. 7
STIM1 promotes phagosomal proteolysis and endomembrane fusion. a Proteolysis was measured in BMDCs exposed to DQ-OVA-Alexa-568 beads. STIM1-deficient cells showed lower levels of DQ-OVA fluorescence at 90 min (right panel). Pre-incubation with BAPTA-AM (40 μM) reduced WT proteolysis to levels similar to STIM1-deficient cells. Lines representing the BAPTA condition are omitted and 90 min points are displaced to the right for clarity. ConcA (0.2 nM) only partially inhibited proteolysis. N = 5/10/3/5/3 (coverslips) comprising a total of 236/1050/237/432/200 (WT) or 264/975/218/405/217 (Stim1 −/−) cells for 30/90/30 + ConcA/90 + ConcA/90 + BAPTA(min). b OVA degradation was measured with anti-OVA immunostainings of isolated phagosomes by flow cytometry. Values are % OVA degradation. Full gating strategy is shown in Supplementary Fig. 7a. Proteolysis was decreased at 30 and 60 min after ingestion. N = 3. c Phago–lysosome (P–L) fusion was measured by exposing Alexa-488-OVAb to cells loaded with lysosomal FRET acceptor Alexa-594-HA. Colour-coded images (left) show the FRET signal at 90 min for WT and STIM1-deficient cells. P–L fusion indices are matched to the colour-coded bar. P–L fusion was decreased in STIM1-deficient cells as compared to WT at 90 min, whereas BAPTA-AM loading further decreased P–L fusion and eliminated differences between WT and Stim1 −/− cells. ConcA decreased P–L fusion to similar levels as BAPTA-loaded cells. N = 3/4/4/3 (coverslips) comprising 470/1009/1691/797 (WT) or 643/1314/1617/503 (Stim1 −/−) phagosomes for 30/90/90 + ConcA/90 + BAPTA (min). d Phago–endosome (P–E) fusion was measured by exposing Alexa-488-OVAb to cells loaded with endosomal FRET acceptor Alexa-594-dextran. P–E fusion was decreased in STIM1-deficient cells as compared to WT. Addition of GSK (10 μM) eliminated differences in P–E fusion. N = 3 (coverslips) comprising a total of 213/244/144/146 (WT) or 210/154/233/253 (Stim1 −/−) cells for 15/30/15 + GSK/30 + GSK(min). Phagocytic targets added at 20:1. e Leu-AMC fluorescent substrate cleavage was reduced in phagosomes isolated from STIM1-deficient cells but not in whole-cell lysates, N = 3. f Periphagosomal IRAP, quantified from single confocal slices, was reduced in STIM1-deficient cells. N = 4 (coverslips). White bars = 10 μm. Error bars are means ± SEM. *p < 0.5, **p < 0.01 using a two-way ANOVA and Sidak’s post test for ad and a Student’s t-test for e and f

References

    1. Ackerman AL, Cresswell P. Cellular mechanisms governing cross-presentation of exogenous antigens. Nat. Immunol. 2004;5:678–684. doi: 10.1038/ni1082. - DOI - PubMed
    1. Manolova V, et al. Nanoparticles target distinct dendritic cell populations according to their size. Eur. J. Immunol. 2008;38:1404–1413. doi: 10.1002/eji.200737984. - DOI - PubMed
    1. Gagnon E, et al. Endoplasmic reticulum-mediated phagocytosis is a mechanism of entry into macrophages. Cell. 2002;110:119–131. doi: 10.1016/S0092-8674(02)00797-3. - DOI - PubMed
    1. Campbell-Valois FX, et al. Quantitative proteomics reveals that only a subset of the endoplasmic reticulum contributes to the phagosome. Mol. Cell. Proteom. 2012;11:M111 016378. doi: 10.1074/mcp.M111.016378. - DOI - PMC - PubMed
    1. Guermonprez P, et al. ER–phagosome fusion defines an MHC class I cross-presentation compartment in dendritic cells. Nature. 2003;425:397–402. doi: 10.1038/nature01911. - DOI - PubMed

Publication types

MeSH terms