Randomized Controlled Trial
. 2017 Nov 27;8(1):1785.
doi: 10.1038/s41467-017-01682-2.

Analyses of gut microbiota and plasma bile acids enable stratification of patients for antidiabetic treatment

Affiliations
Randomized Controlled Trial

Analyses of gut microbiota and plasma bile acids enable stratification of patients for antidiabetic treatment

Yanyun Gu et al. Nat Commun. .

Abstract

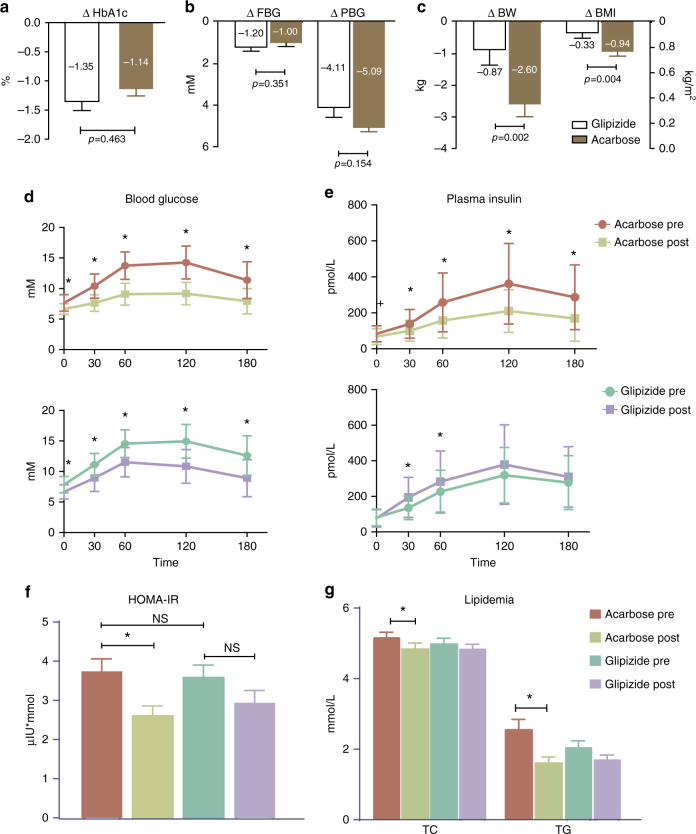
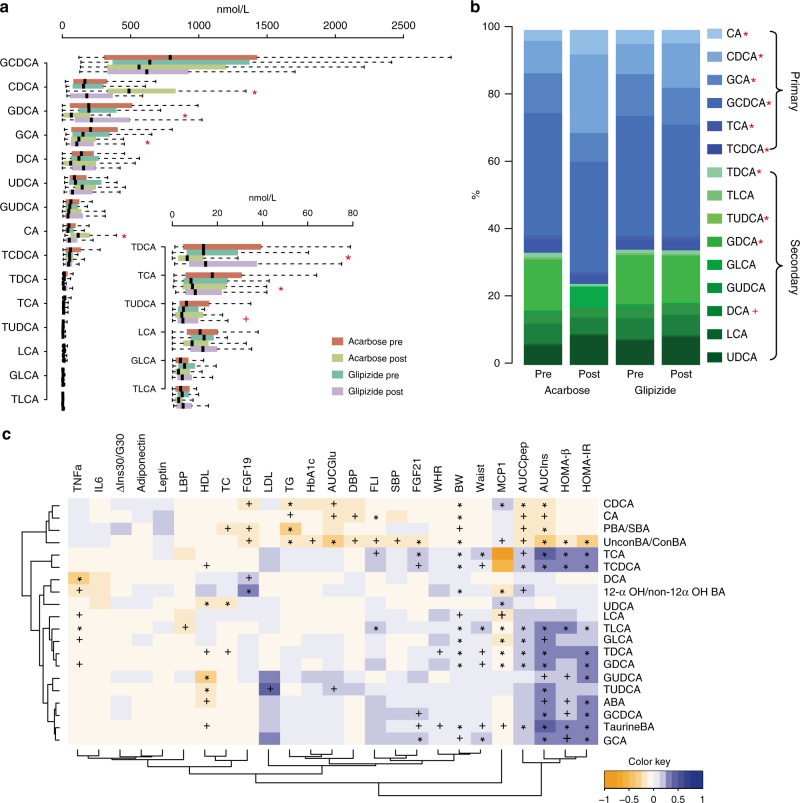
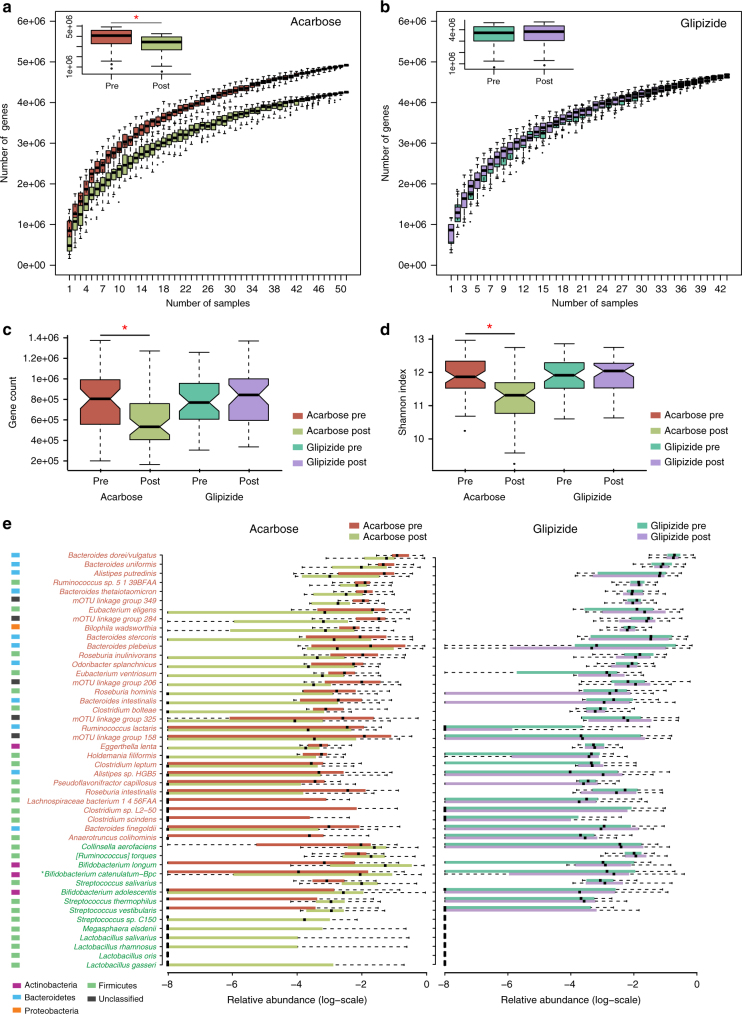
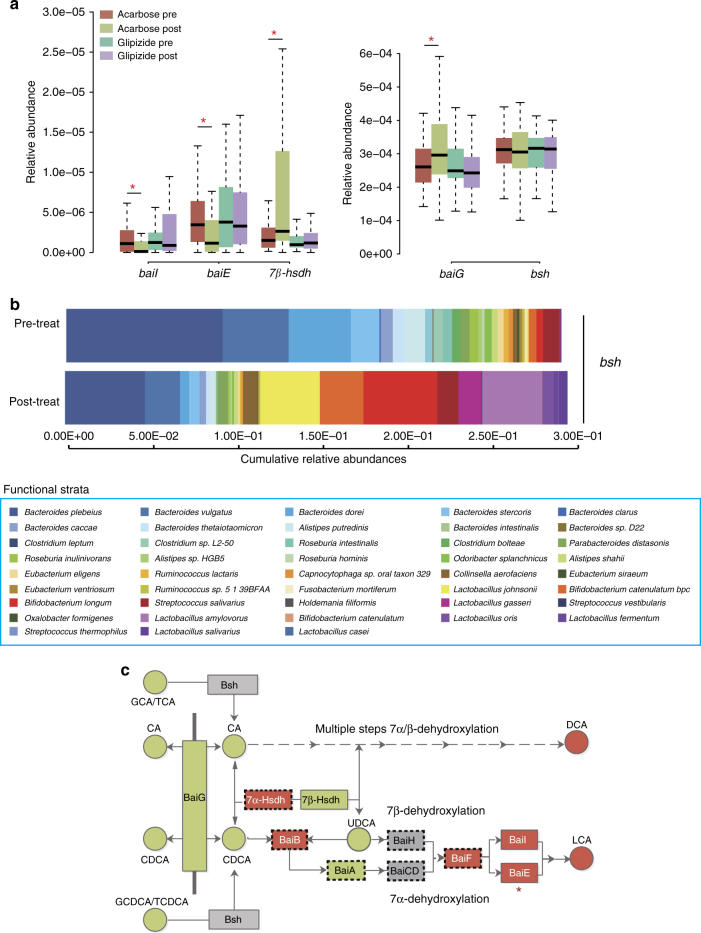
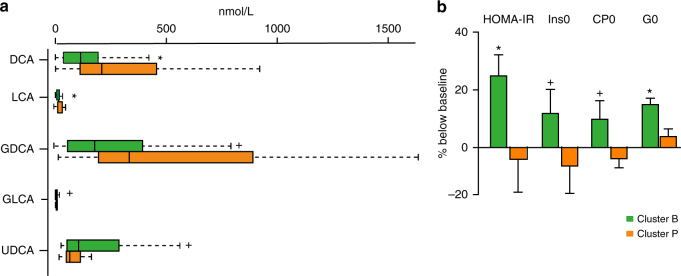
Antidiabetic medication may modulate the gut microbiota and thereby alter plasma and faecal bile acid (BA) composition, which may improve metabolic health. Here we show that treatment with Acarbose, but not Glipizide, increases the ratio between primary BAs and secondary BAs and plasma levels of unconjugated BAs in treatment-naive type 2 diabetes (T2D) patients, which may beneficially affect metabolism. Acarbose increases the relative abundances of Lactobacillus and Bifidobacterium in the gut microbiota and depletes Bacteroides, thereby changing the relative abundance of microbial genes involved in BA metabolism. Treatment outcomes of Acarbose are dependent on gut microbiota compositions prior to treatment. Compared to patients with a gut microbiota dominated by Prevotella, those with a high abundance of Bacteroides exhibit more changes in plasma BAs and greater improvement in metabolic parameters after Acarbose treatment. Our work highlights the potential for stratification of T2D patients based on their gut microbiota prior to treatment.


Conflict of interest statement

The authors declare no competing financial interests.

Figures

Fig. 1
Fig. 1
Major clinical outcomes in patients after 3 months of treatment with Acarbose or Glipizide. a Effect on glycated haemoglobin A1c (HbA1c), in the Acarbose (brown) and Glipizide (white) arms, Wilcoxon rank-sum test. b Effects on fasting blood glucose concentration (FBG), postprandial blood glucose concentration (PBG) in the Acarbose (brown) and Glipizide (white) treatment arms; paired Wilcoxon rank-sum test, *P < 0.01. c Effects on body weight (BW) and body mass index (BMI) in the Acarbose (brown) and Glipizide (white) treatment arms. d Blood glucose excursion curve and e plasma insulin release curve during the meal tests in the two treatment arms, paired Wilcoxon rank-sum test, *P < 0.01, + P < 0.05, pre-treatment vs. post-treatment with Acarbose. f Effects on HOMA-IR, g Total cholesterol (TC) and triglycerides (TG) in the two treatment arms; paired Wilcoxon rank-sum test, *P < 0.01. n = 51 in Acarbose pre and Acarbose post-treatment, n = 43 in Glipizide pre and Glipizide post-treatment
Fig. 2
Fig. 2
Changes in bile acid composition in response to Acarbose treatment correlate with clinical outcomes. a Plasma levels of bile acids (BAs) before and after Acarbose and Glipizide treatments. Results are shown as boxes denoting the interquartile range between the first and third quartiles. The line within the boxes denotes the median, paired Wilcoxon rank-sum test, *P < 0.01, + P < 0.05: Post-treatment vs. Pre-treatment in the Acarbose arm, n = 49 in Acarbose pre and Acarbose post-treatment, n = 43 in Glipizide pre and Glipizide post-treatment. b Changes in the composition of BAs in the two treatment arms; paired Wilcoxon rank-sum test, *P < 0.01, + P < 0.05: Post vs. Pre-treatment in the Acarbose arm. c Multivariate GEE analysis of the contribution of BAs to the main clinical outcomes of Acarbose treatment. *P < 0.01, + P < 0.05, adjusted for BMI, sex and age. The colour key represents the regression coefficients of the independent variables. AUCIns, Area under curve value of plasma insulin level during a meal test; AUCCpep, Area under curve value of plasma C peptide level during a meal test; AUCGlu, Area under curve value of blood glucose level during a meal test; FLI, fatty liver index; LBP, lipopolysaccharides binding protein; ΔIns30/G30 = (Ins30-Ins0)/(G30-G0) during a meal test. TC total cholesterol, LDL low-density of lipoprotein cholesterol, TG triglycerides, HDL high-density of lipoprotein cholesterol, IL6 Interleukin 6, CDCA chenodeoxycholic acid, CA cholic acid, PBA/SBA the ratio of primary BAs vs. secondary BAs, UnconBA/ConBA the ratio of unconjugated BA species vs. conjugated BA species, TCA taurocholic acid, TCDCA taurochenodeoxycholic acid, DCA deoxycholic acid, 12αOH/non-12αOH the ratio of 12αOH vs. non-12αOH BA species, UDCA ursodeoxycholic acid, LCA lithocholic acid, TLCA taurolithocholic acid, GLCA glycolithocholic acid, TDCA taurodeoxycholic acid, GDCA glycodeoxycholic acid, GUDCA glycoursodeoxycholic acid, TUDCA tauroursodeoxycholic acid, ABA sum of all measured plasma BAs, GCDCA glycochenodeoxycholic acid, TaurineBA taurine-conjugated bile acids, GCA glycocholic acid
Fig. 3
Fig. 3
Acarbose elicits stronger impact on the gut microbiota than Glipizide. Effects of Acarbose a and Glipizide b treatments on gene rarefaction, n = 51 in Acarbose pre and Acarbose post-treatment, n = 43 in Glipizide pre-treatment and Glipizide post-treatment. All bar plots are shown as mean ± S.D. The number of genes in each group was calculated after 100 random samplings with replacement. The effects of treatment in both arms on gene richness c and Shannon index d of the gut microbiome, n = 51 in Acarbose pre and Acarbose post-treatment, n = 43 in Glipizide pre and Glipizide post-treatment. e mOTUs significantly changed in abundance by Acarbose treatment (left panel), Benjamini–Hochberg q-value < 0.01, presented in box-plots to illustrate the relative abundances of the different groups. The mOTUs are listed in the order of their relative abundances pre-treatment. mOTUs in red represent mOTUs that decreased in abundance are after Acarbose treatment, whereas mOTUs that increased in abundance are given in green. The phylum colour code is indicated to the left of the mOTU annotation. The same mOTUs did not change after Glipizide treatment (right panel of e). All plotted boxes are interquartile ranges. Dark lines in the boxes indicate medians, the lowest and highest values within 1.5 times IQR from the first and third quartiles. Outliers are shown as circles beyond the whiskers. n = 51 in Acarbose, n = 43 in Glipizide, *Bifidobacterium catenulatum−Bpc: Bifidobacterium catenulatum-Bifidobacterium pseudocatenulatum complex
Fig. 4
Fig. 4
Acarbose treatment affects the potential for secondary bile acid metabolism. a Comparison of the relative abundances of genes encoding enzymes involved in SBA metabolism exhibiting significant alterations in abundance after Acarbose treatment, but not after Glipizide treatment; Plotted boxes are interquartile ranges. Dark lines in the boxes indicate medians, the lowest and highest values within 1.5 times IQR from the first and third quartiles, paired Wilcoxon rank-sum test, *p < 0.01, +p < 0.05. n = 51 in Acarbose pre and Acarbose post-treatment, n = 43 in Glipizide pre and Glipizide post-treatment. baiG, baiI and baiE, bile acid-inducible (bai) gene G, I and E; hsdh, gene encoding hydroxysteroid dehydrogenase, bsh, gene encoding bile salt hydrolase. b Cumulative relative abundances of genes encoding Bsh (EC.3.5.1.24) listed according to the contribution by annotated bacterial species pre-Acarbose and post-Acarbose treatment. The x-axis represents the cumulative relative abundances of genes encoding Bsh. Only species where the genes encoding Bsh constituted more than 0.5% of the total abundance of these genes, and where we observed a significant difference in relative abundances of these genes in response to Acarbose treatment, are included, q < 0.05, paired Wilcoxon rank-sum test. c Schematics of the bacterial BA biotransformation pathways, including deconjugation and multiple steps of 7α/β-dehydroxylation. Faecal BAs and BA-metabolising enzymes encoded by genes enriched after Acarbose treatment are marked in green, those depleted after Acarbose treatment are marked in red; those that did not change in abundance by treatment are marked in grey. *indicates the rate-limiting enzyme of 7α-dehydroxylation. Bsh, bile acid hydrolase; Bai G/B/A/I/H/CD/E/F, enzymes encoded by the bai operon. GCA glycocholic acid, TCA taurocholic acid, GCDCA glycochenodeoxycholic acid, TCDCA taurochenodeoxycholic acid, CA cholic acid, CDCA chenodeoxycholic acid, UDCA ursodeoxycholic acid, DCA deoxycholic acid, LCA lithocholic acid. Boxes framed by dashed lines represent enzymes where the annotation is ambiguous because of inconsistent functional annotation using BlastP based on the Uniprot database vs. BlastKOALA based on the KEGG database. (See Supplementary Methods, Functional annotation of genes involved in BA synthesis based on BLASTP and BlastKOALA for further details)
Fig. 5
Fig. 5
Plasma bile acid composition and therapeutic responses to Acarbose treatment differ in patients with a different baseline microbiota composition. a Plasma composition of bile acids in patients belonging to baseline enterotype-like clusters driven by Bacteroides (Cluster B) or Prevotella (Cluster P). Plasma levels of DCA, LCA, GDCA, GLCA and UDCA differed significantly between Cluster B and Cluster P at the baseline; plotted boxes are interquartile ranges. Dark lines in the boxes indicate medians, the lowest and highest values within 1.5 times IQR from the first and third quartiles, Wilcoxon rank-sum test, *P < 0.01, + P < 0.05. DCA deoxycholic acid, LCA lithocholic acid, GDCA glycodeoxycholic acid, GLCA glycolithocholic acid, UDCA ursodeoxycholic acid. b Percentage changes over baseline levels of fasting blood glucose (G0), insulin (Ins0), C peptide (CP0) and HOMA-IR differed significantly between Cluster B and Cluster P after Acarbose treatment; paired Wilcoxon rank-sum test, *P < 0.01, +P < 0.05. Cluster B, n = 36, Cluster P, n = 15 in Acarbose arm, bar plot is shown as mean ± S.D.

References

    1. Lynch SV, Pedersen O. The human intestinal microbiome in health and disease. N. Engl. J. Med. 2016;375:2369–2379. doi: 10.1056/NEJMra1600266. - DOI - PubMed
    1. Shapiro H, Suez J, Elinav E. Personalized microbiome-based approaches to metabolic syndrome management and prevention. J. Diabetes. 2017;9:226–236. doi: 10.1111/1753-0407.12501. - DOI - PubMed
    1. Qin, J. et al. A metagenome-wide association study of gut microbiota in type 2 diabetes. Nature490, 55–60 (2012). - PubMed
    1. Karlsson FH, et al. Gut metagenome in European women with normal, impaired and diabetic glucose control. Nature. 2013;498:99–103. doi: 10.1038/nature12198. - DOI - PubMed
    1. Aron-Wisnewsky J, Dore J, Clement K. The importance of the gut microbiota after bariatric surgery. Nat. Rev. Gastroenterol. Hepatol. 2012;9:590–598. doi: 10.1038/nrgastro.2012.161. - DOI - PubMed

Publication types

MeSH terms