. 2017 Nov 27;13(11):e1005806.
doi: 10.1371/journal.pcbi.1005806. eCollection 2017 Nov.

Initial-state-dependent, robust, transient neural dynamics encode conscious visual perception

Affiliations

Initial-state-dependent, robust, transient neural dynamics encode conscious visual perception

Alexis T Baria et al. PLoS Comput Biol. .

Abstract

Recent research has identified late-latency, long-lasting neural activity as a robust correlate of conscious perception. Yet, the dynamical nature of this activity is poorly understood, and the mechanisms governing its presence or absence and the associated conscious perception remain elusive. We applied dynamic-pattern analysis to whole-brain slow (< 5 Hz) cortical dynamics recorded by magnetoencephalography (MEG) in human subjects performing a threshold-level visual perception task. Up to 1 second before stimulus onset, brain activity pattern across widespread cortices significantly predicted whether a threshold-level visual stimulus was later consciously perceived. This initial state of brain activity interacts nonlinearly with stimulus input to shape the evolving cortical activity trajectory, with seen and unseen trials following well separated trajectories. We observed that cortical activity trajectories during conscious perception are fast evolving and robust to small variations in the initial state. In addition, spontaneous brain activity pattern prior to stimulus onset also influences unconscious perceptual making in unseen trials. Together, these results suggest that brain dynamics underlying conscious visual perception belongs to the class of initial-state-dependent, robust, transient neural dynamics.


Conflict of interest statement

The authors have declared that no competing interests exist.

Figures

Fig 1
Fig 1. Task paradigm, behavioral results and MEG activity power spectrum.
(A) In every trial, subjects discriminated the orientation of a brief (33–67 ms), low-contrast Gabor patch pointing randomly to upper left or upper right with equal chance, and then reported whether they consciously saw it or not. (B) Left: Percentage of trials in which subjects reported seeing the stimulus (‘seen’), and in which their orientation discrimination was correct (‘correct’). Right: %correct (determined by orientation discrimination) in seen and unseen trials separately. Results show mean and s.e.m. across 11 subjects. (C) Broadband MEG power spectrum averaged across all sensors for each of the 11 subjects (gray to black traces). Red lines correspond to 5, 15, 30, 60 and 150 Hz–boundaries for frequency-band-specific analyses.
Fig 2
Fig 2. SCP (0.05–5 Hz) activity trajectories in seen and unseen trials.
(A) Variance explained by each PC. The top 5 PCs explained >70% variance and are used in subsequent analyses, unless otherwise noted. (B) Trial-averaged activity trajectories in the 3-dimensional PC-space from an example subject, for seen and unseen trials separately, under the presentation of the right-tilt (blue and cyan) or left-tilt stimulus (red and orange). Both plots show the same trajectories (i.e. gray trajectories in each plot are the same as colored trajectories in the other plot). For visualization, a 500-ms-length, half-overlapping moving average window was applied. Dots indicate the locations of each time point from 750 ms before to 2.75 sec after stimulus onset, with 250-ms steps. Circles indicate the time of stimulus onset. Topographical distribution of the PC coefficients is displayed adjacent to each axis. fT: femtotesla. (C) Schematic of Euclidean distance and velocity measurements. (D) Group-average pair-wise Euclidean distance between trajectories shown in B. Blue and red lines show the distance between seen and unseen trajectories under the presentation of the right-tilt (blue) or the left-tilt stimulus (red). Brown and gray lines show the distance between trajectories corresponding to different stimulus orientations under seen and unseen conditions, respectively. Horizontal bar indicates time points at which the distances between seen and unseen trajectories significantly exceed those between left- and right- tilt stimuli (2-way ANOVA, p < 0.05, cluster-based permutation test). (E) Group-average velocity of activity trajectories at each time point for different trial types shown in B. Horizontal bar indicates time points where seen and unseen trajectory velocities significantly differ (2-way ANOVA, p < 0.05, cluster-based permutation test). Shaded areas represent s.e.m. corresponding to the within-subject ANOVA design [61].
Fig 3
Fig 3. PC topographies and single-trial trajectories in the SCP range.
(A) Topographical plots of the PC coefficients for the first 5 PCs in all 11 subjects, aligned across subjects using a correlation procedure (see Methods) to illustrate consistent patterns across subjects. Roman numerals indicate aligned PC topographies. Arabic numerals in the upper-right corner of each plot indicate the original PC ordering for each subject (in descending order of percent variance explained). (B) Single-trial activity trajectories from four representative subjects. Each thin trace represents trajectory averaged across five randomly selected, unique trials within a condition (seen or unseen). Thick lines indicate the average across all seen (black) or unseen (red) trials. Trajectories are plotted from 1 sec before to 3 sec after stimulus onset; black and red dots indicate their origins. Seen and unseen trials follow qualitatively different trajectories at the single-trial level.
Fig 4
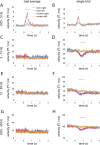
Fig 4. Trial-averaged and single-trial trajectory velocities in different frequency bands.
(A, C, E, G) Trial-averaged trajectory velocity in the 0.05–5 Hz (A), 5–15 Hz (C), 15–30 Hz (E) and 0.05–30 Hz (G) band in seen and unseen trials, split according to stimulus orientation. (B, D, F, H) Single-trial trajectory velocity in the same frequency ranges. Horizontal bars indicate time points where seen and unseen velocities significantly differ (2-way ANOVA, p < 0.05, cluster-based permutation test). Shaded areas represent s.e.m. corresponding to the within-subject ANOVA design.
Fig 5
Fig 5. Single-trial decoding of seen vs. unseen perceptual outcome.
(A) Single-trial classification accuracy using SCP activity across 273 sensors of seen vs. unseen perceptual outcome (magenta). Decoding accuracy is significantly above chance at every time point throughout the epoch (magenta bar). Classification accuracy is attenuated when using the amplitude envelope in this frequency range (green). (B) Similar classification accuracy is found when restricting the analysis to correct trials. (C-D) Temporal generalization of decoding results in A for filtered SCP activity (C) and its amplitude envelope (D), respectively. Rows indicate time points used to train the classifier and columns indicate time points used for testing. (E-H) Same as A-D, but for 5–15 Hz data. (I-L) 15–30 Hz data. (M-P) 0.05–30 Hz data. Horizontal bars indicate time points where decoding accuracy is significantly above chance (p < 0.05, cluster-based permutation test). Shaded areas represent s.e.m. across subjects.
Fig 6
Fig 6. Topographical patterns of SCP activity distinguishing seen from unseen trials.
(A) Grand-average SCP activity topography from 1 sec before to 3 sec after stimulus onset in seen and unseen conditions. (B) Topographic distribution of SVM decoder weights for the classification of seen vs. unseen perceptual outcome, averaged across subjects. (C) Activation patterns contributing to the seen vs. unseen classifiers, averaged across subjects.
Fig 7
Fig 7. Across-trial variability reduction in the SCP range during seen trials.
(A-C) Across-trial variability (s.d.) time course in all sensors for seen & correct (A), unseen & correct (B), and unseen & incorrect (C) conditions, measured as the difference between s.d. at each time point and the mean of the pre-stimulus period. (D) %change of state-space volume as compared to the pre-stimulus period. Brown horizontal bar indicates that in seen & correct condition, the change from baseline was significant from 322 ms to 1087 ms (one-sample t-test, p < 0.05, cluster-based permutation test). Black horizontal bar indicates that variability reduction was significantly greater for seen & correct than for unseen & correct condition from 385 ms to 955 ms (paired t-test, p < 0.05, cluster-based permutation test). Shaded areas represent s.e.m. across subjects.
Fig 8
Fig 8
Single-trial decoding and across-trial variability using the angle (A-B) or norm (C-D) of population SCP activity. (A) Single-trial classification of seen vs. unseen perceptual outcome based on the angle was significantly above chance from 200 ms before to 3 s after stimulus onset (horizontal bar, p < 0.05, cluster-based permutation test). (B) Across-trial variability of angle in seen and unseen conditions. Brown bar indicates time points where angle variability for seen trials was significantly lower than the pre-stimulus baseline; black bar indicates time points where angle variability was significantly different between seen and unseen trials (p < 0.05, cluster-based permutation test). (C) Single-trial classification of seen vs. unseen perceptual outcome based on the norm was not significantly different from chance at any time point. (D) Across-trial variability (s.d.) of the norm in the seen or unseen condition did not exhibit any significant change relative to pre-stimulus baseline or difference between seen and unseen conditions. Shaded areas denote s.e.m. across subjects. (E) Schematic illustrating norm and angle in a 2-dimensional state space. The orange and red trajectories have the same angle at every time point (denoted by circles), but differ in norm. The orange and blue trajectories have the same norm at every time point, but differ in angle.
Fig 9
Fig 9. Pre-stimulus activity influences unconscious perceptual decision making.
(A) Analysis stream. Stimulus-evoked activity templates for each subject were generated by averaging MEG activity in a post-stimulus time window of duration w across trials for each stimulus orientation. Mean pre-stimulus activity in a time window of the same duration was computed for each trial and compared to the two stimulus-evoked templates using spatial correlation. Trials were sorted into two groups by whether their pre-stimulus activity was more similar to the left-tilt or right-tilt stimulus template. A signal detection theory measure of response bias (c) was computed separately for each group of trials. The analysis was conducted using w = 100, 200, 300, 400, 500 ms, separately. (B) Across all trials, subjects tended to answer ‘left’ more often, suggesting that there was an innate response bias, presumably due to fixed stimulus-response mapping. (C) Results from temporal lobe sensors at w = 100 ms and from frontal lobe sensors with w = 500 ms. Error bars represent s.e.m. across subjects.
Fig 10
Fig 10. A schematic summarizing our results.
Trajectories of seen trials (examples shown as green lines) begin in a location distinct from those of unseen trials (examples shown as red lines). The time of stimulus onset is indicated by circles, and different stimulus orientations are indicated by solid or dashed lines. For seen trials, the voyage of the trajectory through state space is characterized by marked increase in velocity following stimulus onset, indicated by the length of black arrows. Unseen trials, on the other hand, only accelerate minimally following stimulus onset, indicated by the length of gray arrows. Seen and unseen trajectories remain well separated throughout the trial. For seen trials, across-trial variability decreases substantially following stimulus onset (shown as green shading), suggesting that the trajectories are robust to small variations in the initial location.

References

    1. Dehaene S. (2014) Consciousness and the Brain, Viking Press.
    1. Kahneman D. (2013) Thinking, Fast and Slow, Farrar, Straus and Giroux.
    1. Wyart V. and Tallon-Baudry C. (2009) How ongoing fluctuations in human visual cortex predict perceptual awareness: baseline shift versus decision bias. J Neurosci 29 (27), 8715–25. doi: 10.1523/JNEUROSCI.0962-09.2009 - DOI - PMC - PubMed
    1. Ergenoglu T. et al. (2004) Alpha rhythm of the EEG modulates visual detection performance in humans. Brain Res Cogn Brain Res 20 (3), 376–83. doi: 10.1016/j.cogbrainres.2004.03.009 - DOI - PubMed
    1. Mathewson K.E. et al. (2009) To see or not to see: prestimulus alpha phase predicts visual awareness. J Neurosci 29 (9), 2725–32. doi: 10.1523/JNEUROSCI.3963-08.2009 - DOI - PMC - PubMed

LinkOut - more resources