. 2017 Nov 27;13(11):e1006733.
doi: 10.1371/journal.ppat.1006733. eCollection 2017 Nov.

Inhibition of group-I metabotropic glutamate receptors protects against prion toxicity

Affiliations

Inhibition of group-I metabotropic glutamate receptors protects against prion toxicity

Despoina Goniotaki et al. PLoS Pathog. .

Abstract

Prion infections cause inexorable, progressive neurological dysfunction and neurodegeneration. Expression of the cellular prion protein PrPC is required for toxicity, suggesting the existence of deleterious PrPC-dependent signaling cascades. Because group-I metabotropic glutamate receptors (mGluR1 and mGluR5) can form complexes with the cellular prion protein (PrPC), we investigated the impact of mGluR1 and mGluR5 inhibition on prion toxicity ex vivo and in vivo. We found that pharmacological inhibition of mGluR1 and mGluR5 antagonized dose-dependently the neurotoxicity triggered by prion infection and by prion-mimetic anti-PrPC antibodies in organotypic brain slices. Prion-mimetic antibodies increased mGluR5 clustering around dendritic spines, mimicking the toxicity of Aβ oligomers. Oral treatment with the mGluR5 inhibitor, MPEP, delayed the onset of motor deficits and moderately prolonged survival of prion-infected mice. Although group-I mGluR inhibition was not curative, these results suggest that it may alleviate the neurological dysfunctions induced by prion diseases.


Conflict of interest statement

Fabrizio Gasparini is employed by a commercial company, Novartis Institutes for BioMedical Research. Neither Dr. Gasparini nor Novartis stand to gain, directly or indirectly, from the publication of the present manuscript. All the authors have declared that no competing interests exist.

Figures

Fig 1
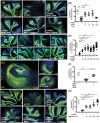
Fig 1. mGluR1/5 inhibition rescues prion neurotoxicity in organotypic slice cultures.
(A-B) Treatment with the mGluR5 inhibitor (MPEP) rescued neurodegeneration in tga20 RML6-treated COCS. (A) Fluorescence micrographs of tga20 COCS. RML6-induced ablation of the cerebellar granular layer (CGL) was significantly ameliorated by the mGluR5 inhibitor, MPEP. All scale bars: 500μm. (B) NeuN coverage in tga20 COCS exposed to RML6 or NBH and treated with MPEP at 21–45 days post inoculation (dpi), expressed as percentage of NBH samples. Each dot represents a pool of 4–10 slices cultured in the same well. Data points are mean ± s.d.; one-way ANOVA followed by Dunnett’s post-hoc test. (C-D) Treatment with the mGluR5 inhibitor AFQ056 (mavoglurant) also rescued neurodegeneration in tga20 RML6-treated COCS (experimental conditions as in panels A-B). (E-F) Treatment with the mGluR5 inhibitor (MPEP) rescued neurodegeneration in tga20 RML6-treated HOCS. (E) Fluorescence micrographs of tga20 HOCS, showing ablation of hippocampal neurons induced by RML6 infection (middle), that is significantly ameliorated by addition of the IC50 concentration of MPEP (36nM, 21–45 dpi, right). (F) Morphometry of the experiment shown in panel E. (G) Treatment with the mGluR1 inhibitor (YM202074) rescued neurodegeneration in tga20 RML6-treated COCS. Experimental conditions were the same as in the panels above. (H) Morphometry of the experiment shown in panel G; *: P < 0.05, **: P < 0.01, ***: P < 0.001; For (A), (C), (E) and (G) panels: Scale bar is 500μm.
Fig 2
Fig 2. mGluR5 inhibition delays prion disease in wild-type mice.
(A-B) MPEP improves motor performance in mouse models of prion disease. Motor abilities of MPEP-treated and control C57BL/6J males were assessed by rotarod after i.c. innoculation with 3 log LD50 (A) and 5 log LD50 (B) units of RML6 prions. Dot plots: latency to fall (seconds). Each dot corresponds to a mouse. Two-way ANOVA per each time point revealed a significant difference between MPEP treated and MPEP untreated groups at 19-22wpi (*: P<0.05 and **: P<0.01) for mice injected with 3 log LD50 RML6 units and at 21-23wpi (*: P<0.05 and **: P<0.001) for mice injected with 5 log LD50 RML6 units respectively, n = 10 mice per group. Shaded areas represent standard deviations. (C-D) mGluR5 inhibition (MPEP treatment) significantly prolonged survival in mouse models of prion disease. Survival curves of MPEP treated and MPEP untreated C57BL/6J males, inoculated i.c. with 3 log LD50 and 5 log LD50 units of RML6 prions respectively. (C) Mice inoculated with 3 log LD50 RML6 units: MPEP untreated group, n = 10, median incubation time 183 days post inoculation (dpi). MPEP treated group, n = 10, median incubation time 190 dpi; P = 0.0008; log-rank test. (D) Mice inoculated with 5 log LD50 RML6 units: MPEP untreated group, n = 10, median incubation time: 188.5 dpi, P = 0.0008; MPEP treated group, n = 10, median incubation time: 195dpi, P = 0.0231; log-rank test.
Fig 3
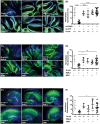
Fig 3. Group-I mGluR inhibition abolishes GDL toxicity in organotypic slice cultures.
(A-B) Treatment with the mGluR5 inhibitor (MPEP) rescued neurodegeneration in scPOM1-treated COCS from tga20 mice. (A) Ablation of the cerebellar granular layer (CGL) after exposure of tga20 COCS to scPOM1, and amelioration by MPEP. (B) NeuN morphometry of tga20 slices exposed to scPOM1 or control (scPOM1 blocked with recPrP) and treated with MPEP at 14–28 days post exposure (dpe). (C) CGL ablation after exposure to scPOM1, and amelioration by AFQ056. (D) NeuN morphometry of tga20 slices exposed to scPOM1 or control scPOM1 blocked with recPrP and treated with MPEP from 14–22 dpe. (E-F) Treatment with MPEP rescued neurodegeneration in tga20 scPOM1-treated COCS. (E) Ablation of the hippocampal neuronal layer induced by exposure of HOCS to scPOM1 (middle), and amelioration by MPEP. (F) NeuN morphometry of tga20 slices exposed to scPOM1 or control (scPOM1 blocked with recPrP) and treated with MPEP from 14–22 dpe. (G-H) Treatment with the mGluR1 inhibitor (YM202074) rescued neurodegeneration in tga20 scPOM1-treated COCS. (G) Ablation of the CGL in COCS by exposure to scPOM1, and suppression of toxicity by the mGluR1 antagonist, YM202074. (H) NeuN morphometry of tga20 slices as in panel F, but treated with YM202074 (14–22 dpe). All scale bars: 500μm. For (B), (D), (F) and (H): NeuN relative signal intensity as percentage of scPOM1+recPrP control samples. Each dot represents a pool of 7–10 cerebellar slices or 4–6 hippocampal slices cultured in the same well; Data are presented as mean ± s.d.; One-way ANOVA followed by Dunnett’s post-hoc test; **: P < 0.01, ***: P < 0.001.
Fig 4
Fig 4. Grm5 ablation protects against GDL and prion-induced neurotoxicity in slice cultures.
(A-B) scPOM1 induced CGL profound neurotoxicity in Grm5+/+ slices. However, toxicity was much less pronounced in Grm5+/- and Grm5-/- slices. (B) NeuN morphometry of Grm5+/- and Grm5-/- and Grm5+/+ slices exposed to scPOM1 or scPOM1 blocked with recPrP from 14–22 dpe. (C-D) CGL ablation induced by RML6 infection in control Grm5+/+ slices, and amelioration in Grm5+/- and Grm5-/- slices. Slices were maintained in culture for 60 dpi. (E-F) Genetic ablation of Grm5 rescued prion-induced neurodegeneration in HOCS. (E) Representative images of HOCS, showing ablation of the hippocampal neuronal layer induced by RML6 infection in control Grm5+/+ slices, that is significantly ameliorated by the genetic deletion of Grm5 (Grm5-/- slices). Slices were maintained in culture for 60 dpi. (F) NeuN morphometry of Grm5+/- and Grm5-/- and Grm5+/+ slices exposed to RML6 or NBH. RML6-induced neurodegeneration is rescued in the Grm5+/- and Grm5-/- HOCS. All scale bars: 500 μm. (B), (D) and (F): NeuN relative signal intensity as percentage of control samples (Grm5+/+, NBH or POM1+recPrP); each dot corresponds to a pool of 7–10 cerebellar slices or 4–6 hippocampal slices cultured in the same well; Data are presented as mean ± s.d.; One-way ANOVA followed by Dunnett’s post-hoc test. *: P < 0.05, **: P < 0.01, ****: P < 0.0001.
Fig 5
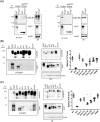
Fig 5. mGluR-interacting domains on PrPC.
(A) Brain homogenate from wild-type (C57BL/6J) and Prnpo/o mice was subjected to immunoprecipitation by POM1 followed by immunoblotting using polyclonal anti-mGluR5 (right) or anti-mGluR1 (left) and anti-PrPC antibodies. Control conditions (POM1 blocked by recombinant PrPC) were run in parallel. The typical mGluR bands of 250kDa and 150kDa were detected in wild-type extract only when immunoblotting with mGluR1 or mGluR5 antibody. Total brain extracts were in parallel subjected to Western blot analysis to control for endogenous levels of mGluR5/1 and PrPC. (B-C) Mapping the mGluR5 and mGluR1 interacting domains on PrPC. Brain homogenate from Tga20, Prnpo/o (ZH3) and amino proximal deletion mutants of PrPC was subjected to immunoprecipitation by anti-mGluR5 (B) or anti-mGluR1 (C) antibodies. For detection, we used polyclonal antibodies to mGluR5, mGluR1, and PrPC. Deletions encompassing residues 111–134 of PrPC reduced its interaction with mGluR5, whereas deletions of residues 51–90 or 11–134 decreased the interaction with mGluR1. Total brain extracts (TEs) were subjected to Western blot analysis to control for endogenous levels of mGluR5/1 and PrPC. Densitometric quantitation of the PrPC signal was normalized over the ratio of PrP/Actin signal in TEs. N = 3–5; One-way ANOVA followed by Tukey’s post-hoc test. Asterisk: P<0.05.
Fig 6
Fig 6. MPEP treatment reduces vacuole size and astrogliosis in prion-infected mice.
(A-B) GFAP-stained cerebellar sections from C57BL/6J mice injected i.c. with NBH or RML6 prions and treated with control or MPEP-containing food respectively. Image areas as in figure (A) show spongiform vacuoles in the cerebellum. (B) Mean ± SD of vacuole size was quantified as white area over the total area. Each graph shows a treatment group. (C) Astrocyte proliferation was analyzed by immunohistochemistry with the GFAP antibody in paraffin-embedded sections of hippocampal areas from C57BL/6J mice injected i.c. with NBH or RML6 prions and treated with control or MPEP-containing food respectively. (D) Number of GFAP+ cells was quantified in the hippocampus. Each graph corresponds to a treatment group. GFAP staining was markedly reduced in MPEP-treated mice exposed to RML6 (3 log ID50 units). Graphs represent mean ± SD GFAP expression, quantified as the percentage of the surface occupied by the GFAP staining over the total measured area. For all graphs, quantification was based on 10 regions of interest per slice, 4 slices per mouse and 4 mice per treatment group. ****P<0.0001, **P<0.01; two-way ANOVA followed by Bonferroni's post-hoc test.
Fig 7
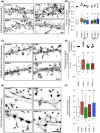
Fig 7. Exposure to Fab1-POM1 increases mGluR5 and PrPC translocation to dendritic spines.
(A-B) mGluR5 immunoreactivity following Fab1-POM1 administration to live neurons. Quantification of fluorescence intensity (B) showed significantly increased size of mGluR5 clusters following exposure of live neurons to Fab1-POM1 compared to Fab1-POM2 or Fab1-POM3. “ex vivo”: antibody administration to live neurons; “post mortem”: administration to fixed neurons. The number of images analyzed was: 88 (control), 90 (POM1/live), 59 (POM2/live), 60 (POM3/live), and 30 (POM1/fixed; POM2/fixed; POM3). Results were pooled from three (ex vivo) or two (post-mortem) independent experiments and distribution of the intensity is plotted (median, quartile, 10–90% distribution). The box plot shows median, quartile and 10–90% distribution and Mann-Whitney test was performed to quantify the differences in distribution. Averaged mGluR5s intensity of clusters per experiment (normalized to control) is also shown in top panel to represent experimental reproducibility (Controls = 1; POM1 (live) = 1.36, 1.19, 1.16; POM2 (live) = 1.17, 1.13, 1.01, POM3 (live) = 1.10, 1.11, 0.89; POM1 (fixed) = 1.14, 0.89; POM2 (fixed) = 1.21, 1.01; POM3 (fixed) = 1.30, 0.93). (C-D) Increased mGluR5s immunoreactivity in dendritic spines following Fab1-POM1 exposure. (C) Representative images showing the expression of mGluR5-pHluorin in untreated and Fab1-POM1-treated neurons (1 μg, 1 h). (D) Fluorescence ratio (spine/shaft) emphasizing the increase in mGluR5-pHluorin level in spines following exposure to Fab1-POM1, but not to Fab1-POM2 or a mixture of Fab1-POM1 and Fab1-POM2. Number of spines analyzed (n): 821 (control), 894 (Fab1-POM1), 739 (Fab1-POM2), 669 (Fab1-POM1+2). The box plot shows median, quartile and 10–90% distribution and Mann-Whitney test was performed. Averaged (normalized to control) spine enrichment value per experiment is also shown (top panel) to represent experimental reproducibility (Controls = 1; POM1 = 1.18, 1.10, 1.03; POM2 = 1.03, 0.96, 0.98; POM1+2 = 1.00, 0.97; 1.07). (E-F) Spine enrichment of PrPC following exposure to Fab1-POM1. (E) Single-molecule detection of PrPC-Dendra by photoactivated localization microscopy (PALM) on dendritic spines and shafts for untreated or following antibody treatment (1μg, 1h). (F) Ratio of molecular density in spine versus dendritic shaft emphasizing spine-enrichment of PrPC-Dendra following exposure to Fab1-POM1 but not to other antibodies. Number of spines analyzed (n): 318 (control), 328 (POM1), 364 (POM2), 331 (POM1+2), 416 (POM3). All plots show median, quartile and 10–90% range. Mann-Whitney test; *p<0.05, ***p<0.001, ns = non-significant. Scale bars: 2μm.
Fig 8
Fig 8. Model of the interactions between mGluR5, PrPC, and anti-PrP antibodies.
(A) In untreated neurons, mGluR5-PrPC complexes are distributed within and outside spines. Upon exposure to prion-mimetic antibodies (B), mGluR5 translocates to the spine, where it may enhance neurotoxicity by contributing to a Ca2+ overload. (C) Exposure to POM2, in contrast, engages the N-terminal “flexible tail” of PrPC, thereby making it unavailable to mGluR5. Consequently, mGluR5-PrPC (and possibly also mGluR1-PrPC) complexes do not translocate to spines. As a result, POM2 affords functional neuroprotection similarly to mGluR5 antagonists. (D) We speculate that prion infection may trigger topological rearrangements similar to those observed after POM1 exposure.

References

    1. Prusiner SB. Prions. Proc Natl Acad Sci U S A. 1998;95(23):13363–83. doi: 10.1073/pnas.95.23.13363 - DOI - PMC - PubMed
    1. Brandner S, Isenmann S, Raeber A, Fischer M, Sailer A, Kobayashi Y, et al. Normal host prion protein necessary for scrapie-induced neurotoxicity. Nature. 1996;379(6563):339–43. doi: 10.1038/379339a0 - DOI - PubMed
    1. Moreno JA, Halliday M, Molloy C, Radford H, Verity N, Axten JM, et al. Oral treatment targeting the unfolded protein response prevents neurodegeneration and clinical disease in prion-infected mice. Sci Transl Med. 2013;5(206):206ra138 doi: 10.1126/scitranslmed.3006767 - DOI - PubMed
    1. Roucou X, Gains M, LeBlanc AC. Neuroprotective functions of prion protein. J Neurosci Res. 2004;75(2):153–61. doi: 10.1002/jnr.10864 - DOI - PubMed
    1. Hernandez-Rapp J, Martin-Lanneree S, Hirsch TZ, Launay JM, Mouillet-Richard S. Hijacking PrP(c)-dependent signal transduction: when prions impair Abeta clearance. Front Aging Neurosci. 2014;6:25 doi: 10.3389/fnagi.2014.00025 - DOI - PMC - PubMed

MeSH terms

LinkOut - more resources