

A 23-year retrospective investigation of Salmonella Typhi and Salmonella Paratyphi isolated in a tertiary Kathmandu hospital
- PMID: 29176850
- PMCID: PMC5720835
- DOI: 10.1371/journal.pntd.0006051
A 23-year retrospective investigation of Salmonella Typhi and Salmonella Paratyphi isolated in a tertiary Kathmandu hospital
Abstract
Background: Salmonella serovars Typhi (S. Typhi) and Paratyphi A (S. Paratyphi A), the causative agents of enteric fever, have been routinely isolated organisms from the blood of febrile patients in the Kathmandu Valley since the early 1990s. Susceptibility against commonly used antimicrobials for treating enteric fever has gradually changed throughout South Asia since this time, posing serious treatment challenges. Here, we aimed to longitudinally describe trends in the isolation of Salmonella enterica and assess changes in their antimicrobial susceptibility in Kathmandu over a 23-year period.
Methods: We conducted a retrospective analysis of standardised microbiological data from April 1992 to December 2014 at a single healthcare facility in Kathmandu, examining time trends of Salmonella-associated bacteraemia and the corresponding antimicrobial susceptibility profiles of the isolated organisms.
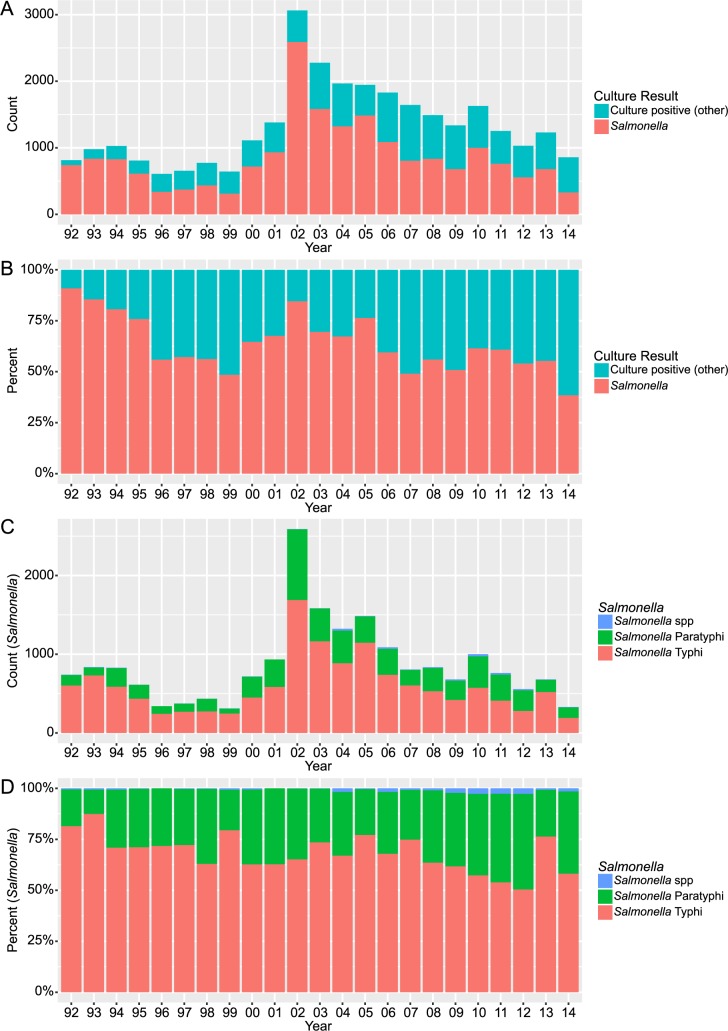
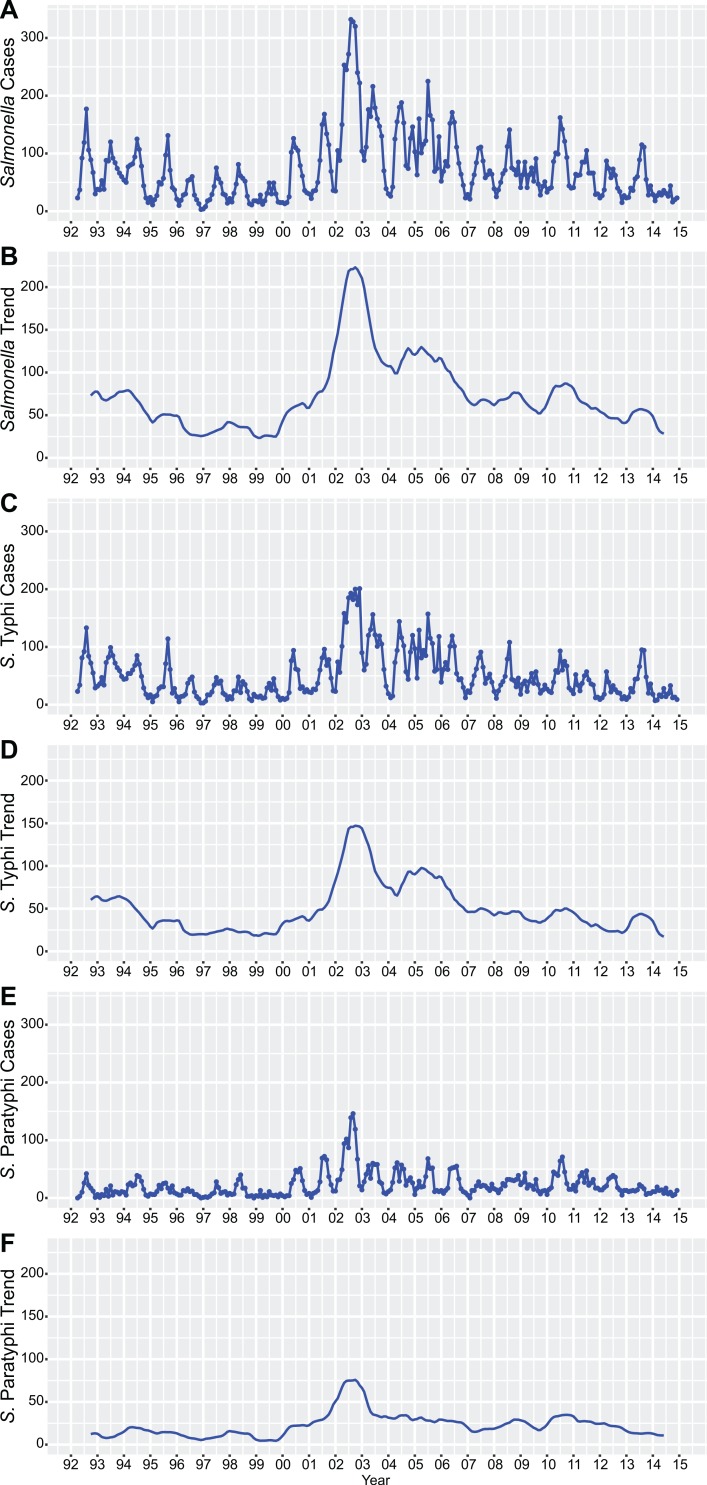
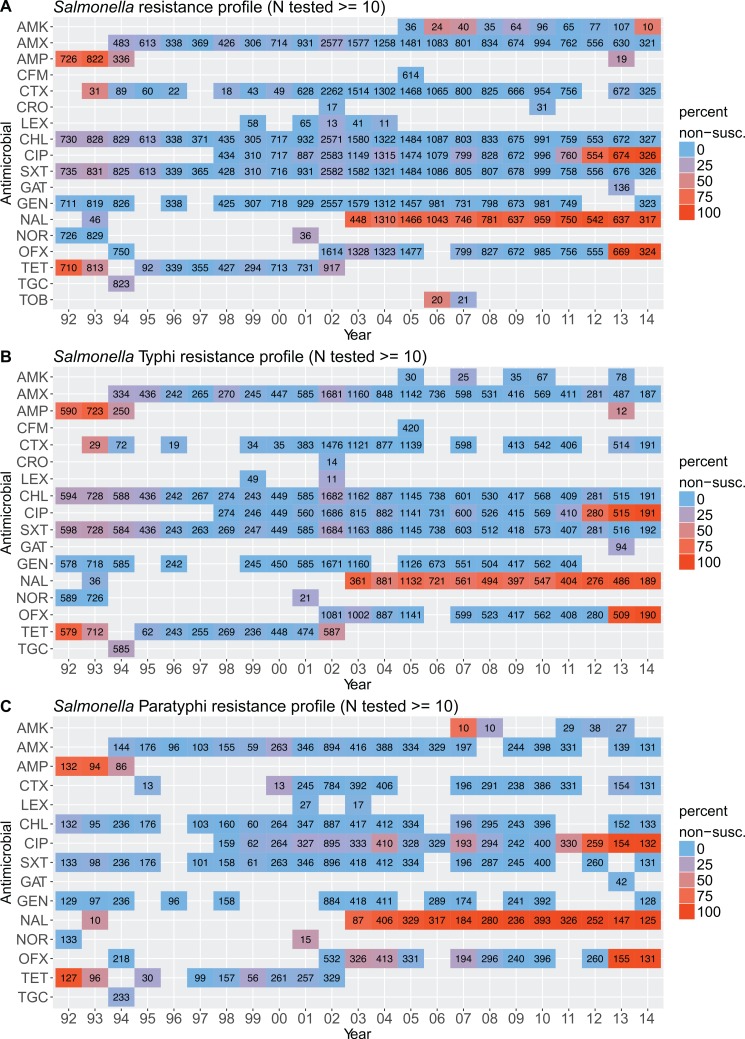
Results: Over 23 years there were 30,353 positive blood cultures. Salmonella enterica accounted for 65.4% (19,857/30,353) of all the bacteria positive blood cultures. S. Typhi and S. Paratyphi A were the dominant serovars, constituting 68.5% (13,592/19,857) and 30.5% (6,057/19,857) of all isolated Salmonellae. We observed (i) a peak in the number of Salmonella-positive cultures in 2002, a year of heavy rainfall and flooding in the Kathmandu Valley, followed by a decline toward pre-flood baseline by 2014, (ii) an increase in the proportion of S. Paratyphi in all Salmonella-positive cultures between 1992 and 2014, (iii) a decrease in the prevalence of MDR for both S. Typhi and S. Paratyphi, and (iv) a recent increase in fluoroquinolone non-susceptibility in both S. Typhi and S. Paratyphi isolates.
Conclusions: Our work describes significant changes in the epidemiology of Salmonella enterica in the Kathmandu Valley during the last quarter of a century. We highlight the need to examine current treatment protocols for enteric fever and suggest a change from fluoroquinolone monotherapy to combination therapies of macrolides or cephalosporins along with older first-line antimicrobials that have regained their efficacy.
Conflict of interest statement
The authors have declared that no competing interests exist.
Figures

References
-
- Crump JA, Sjölund-Karlsson M, Gordon MA, Parry CM. Epidemiology, Clinical Presentation, Laboratory Diagnosis, Antimicrobial Resistance, and Antimicrobial Management of Invasive Salmonella Infections. Clin Microbiol Rev. 2015;28: 901–37. doi: 10.1128/CMR.00002-15 - DOI - PMC - PubMed
-
- Buckle GC, Walker CLF, Black RE. Typhoid fever and paratyphoid fever: Systematic review to estimate global morbidity and mortality for 2010. J Glob Health. 2012;2: 10401 doi: 10.7189/jogh.02.010401 - DOI - PMC - PubMed
-
- Mogasale V, Maskery B, Ochiai RL, Lee JS, Mogasale V V, Ramani E, et al. Burden of typhoid fever in low-income and middle-income countries: a systematic, literature-based update with risk-factor adjustment. Lancet Glob Heal. 2014;2: e570–e580. doi: 10.1016/S2214-109X(14)70301-8 - DOI - PubMed
-
- Murdoch DR, Woods CW, Zimmerman MD, Dull PM, Belbase RH, Keenan AJ, et al. The etiology of febrile illness in adults presenting to Patan hospital in Kathmandu, Nepal. Am J Trop Med Hyg. 2004;70: 670–5. - PubMed
-
- Maskey AP, Basnyat B, Thwaites GE, Campbell JI, Farrar JJ, Zimmerman MD. Emerging trends in enteric fever in Nepal: 9124 cases confirmed by blood culture 1993–2003. Trans R Soc Trop Med Hyg. 2008;102: 91–5. doi: 10.1016/j.trstmh.2007.10.003 - DOI - PubMed
MeSH terms
Substances
Grants and funding
LinkOut - more resources
Full Text Sources
Other Literature Sources
Miscellaneous
