

Cardiovascular and Cutaneous Responses to the Combination of Alcohol and Soft Drinks: The Way to Orthostatic Intolerance?
- PMID: 29176950
- PMCID: PMC5686118
- DOI: 10.3389/fphys.2017.00860
Cardiovascular and Cutaneous Responses to the Combination of Alcohol and Soft Drinks: The Way to Orthostatic Intolerance?
Abstract
Aim: Acute ingestion of alcohol is often accompanied by cardiovascular dysregulation, malaise and even syncope. The full hemodynamic and cutaneous responses to the combination of alcohol and sugar (i.e., alcopops), a common combination in young people, and the mechanisms for the propensity to orthostatic intolerance are not well established. Thus, the purpose of this study was to evaluate the cardiovascular and cutaneous responses to alcopops in young subjects. Methods: Cardiovascular and cutaneous responses were assessed in 24 healthy young subjects (12 men, 12 women) sitting comfortably and during prolonged active standing with a 30-min baseline and 130 min following ingestion of 400 mL of either: water, water + 48 g sugar, water + vodka (1.28 mL.kg-1 of body weight, providing 0.4 g alcohol.kg-1), water + sugar + vodka, according to a randomized cross-over design. Results: Compared to alcohol alone, vodka + sugar induced a lower breath alcohol concentration (BrAC), blood pressure and total peripheral resistance (p < 0.05), a higher cardiac output and heart rate (p < 0.05) both in sitting position and during active standing. In sitting position vodka + sugar consumption also led to a greater increase in skin blood flow and hand temperature (p < 0.05) and a decrease in baroreflex sensitivity (p < 0.05). We observed similar results between men and women both in sitting position and during active standing. Conclusion: Despite lower BrAC, ingestion of alcopops induced acute vasodilation and hypotension in sitting position and an encroach of the hemodynamic reserve during active standing. Even if subjects did not feel any signs of syncope these results could be of clinical importance with higher doses of alcohol or if combined to other hypotensive challenges.
Keywords: active standing; alcohol; cutaneous blood flow; hemodynamics; sugar.
Figures
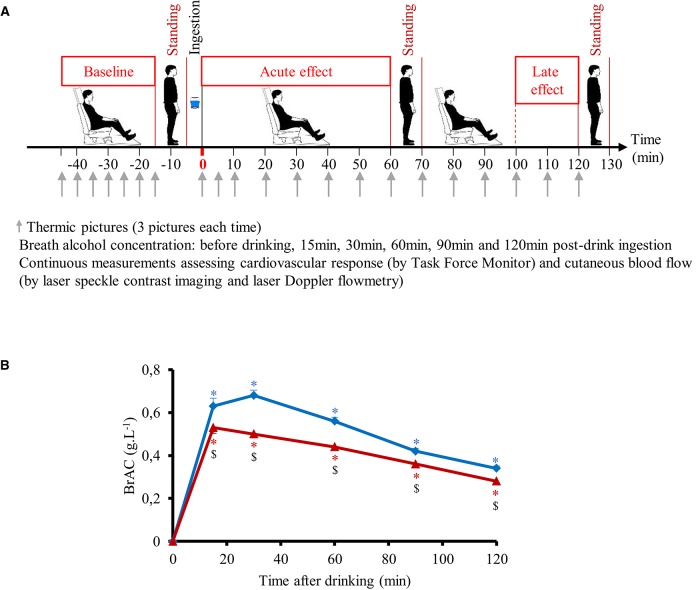
 ) or water + vodka + sugar (
 ). BrAC at 15 min includes 21 subjects because BrAC at this timepoint was not measured in the first three subjects included in the study. All other timepoints include 24 subjects. *p < 0.05 significant differences over time from baseline values; $p < 0.05 significant different between responses to the drinks.
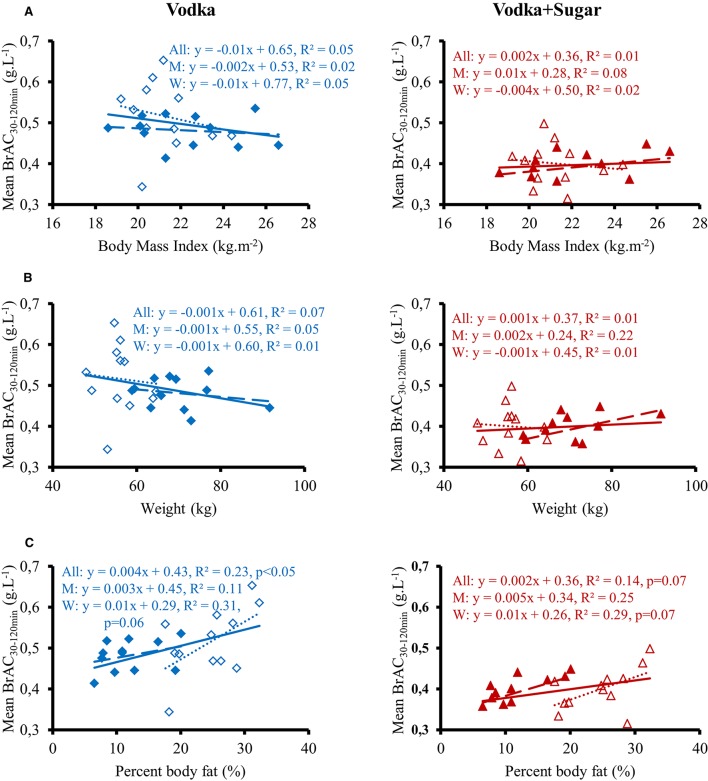
 , – –) and 12 women (Δ, ……) and body mass index (A), weight (B), and percent body fat (C) after drinking vodka (left panel) and vodka + sugar (right panel).
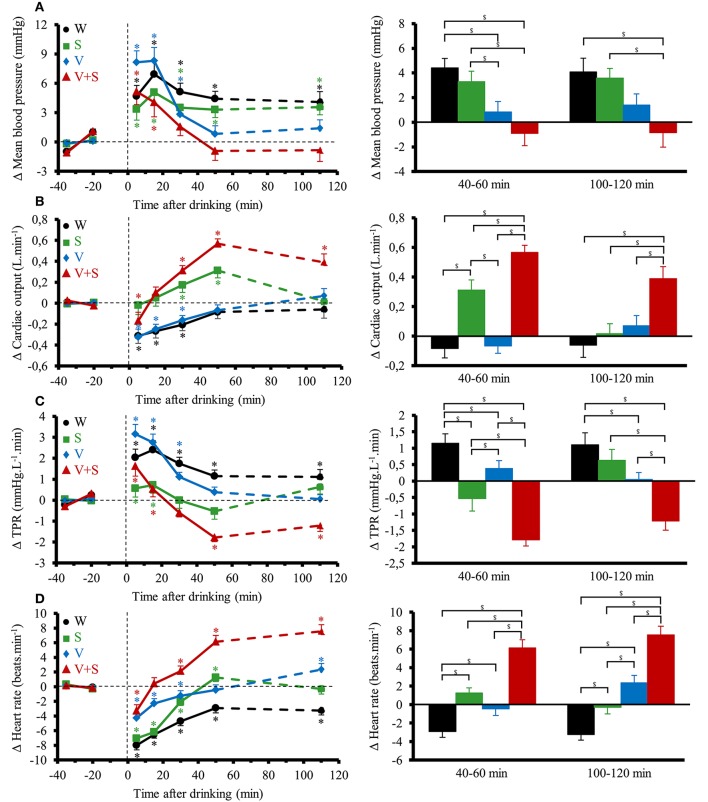
 ,
,  ; water + sugar (S)
  ,
,  ; water + vodka (V) ,
  ; water + vodka + sugar (V+S) ,
  . *p < 0.05 significant differences over time from baseline values; $p < 0.05 significant differences between responses to the drinks.
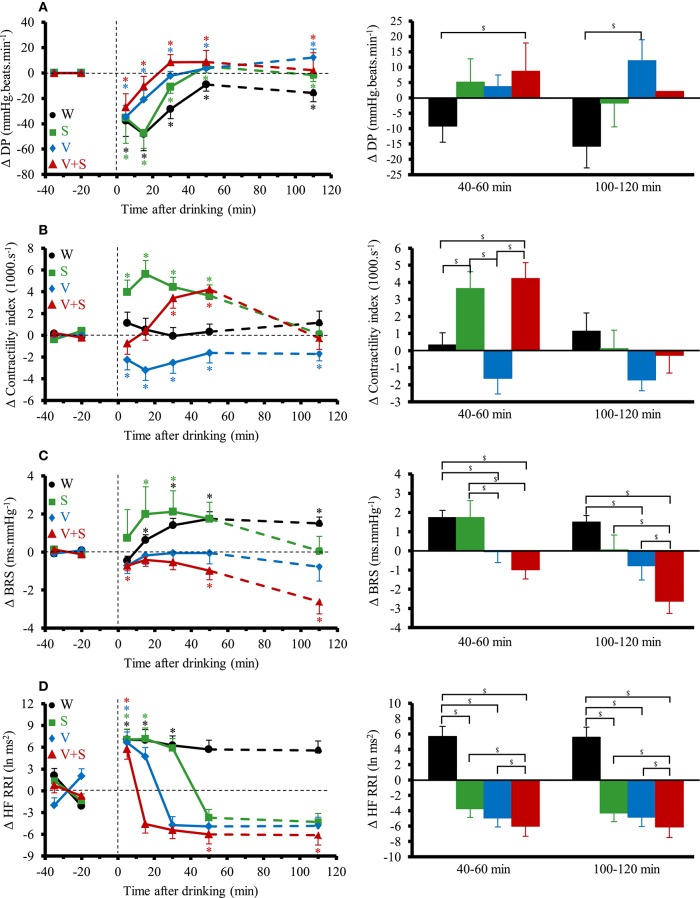 , ; water + sugar (S) , ; water + vodka (V) , ; water + vodka + sugar (V+S) , . *p < 0.05 significant differences over time from baseline values; $p < 0.05 significant differences between responses to the drinks.
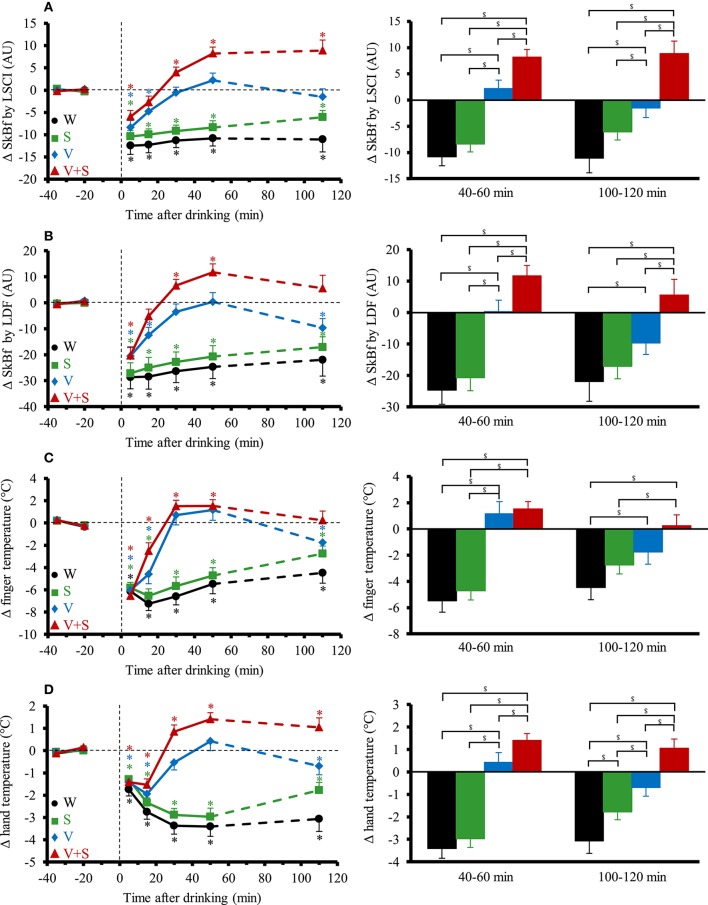 , ; water + sugar (S) , ; water + vodka (V) , ; water + vodka + sugar (V+S) , . *p < 0.05 significant differences over time from baseline values; $p < 0.05 significant differences between responses to the drinks.
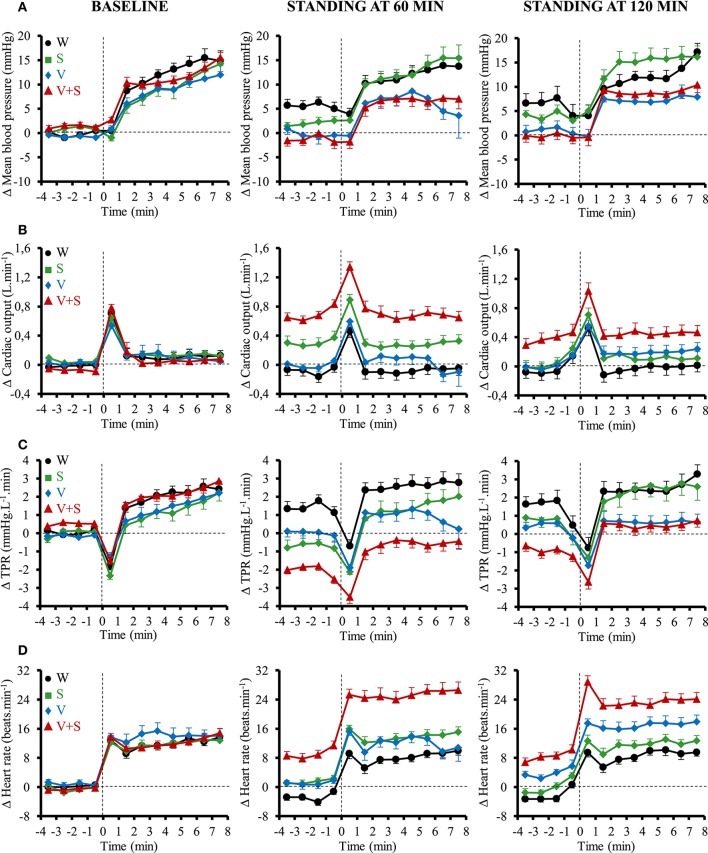 , ; water + sugar (S) , ; water + vodka (V) , ; water + vodka + sugar (V+S) , .
References
LinkOut - more resources
Full Text Sources
Other Literature Sources