

Genome-Wide Association Mapping of Flowering and Ripening Periods in Apple
- PMID: 29176988
- PMCID: PMC5686452
- DOI: 10.3389/fpls.2017.01923
Genome-Wide Association Mapping of Flowering and Ripening Periods in Apple
Abstract
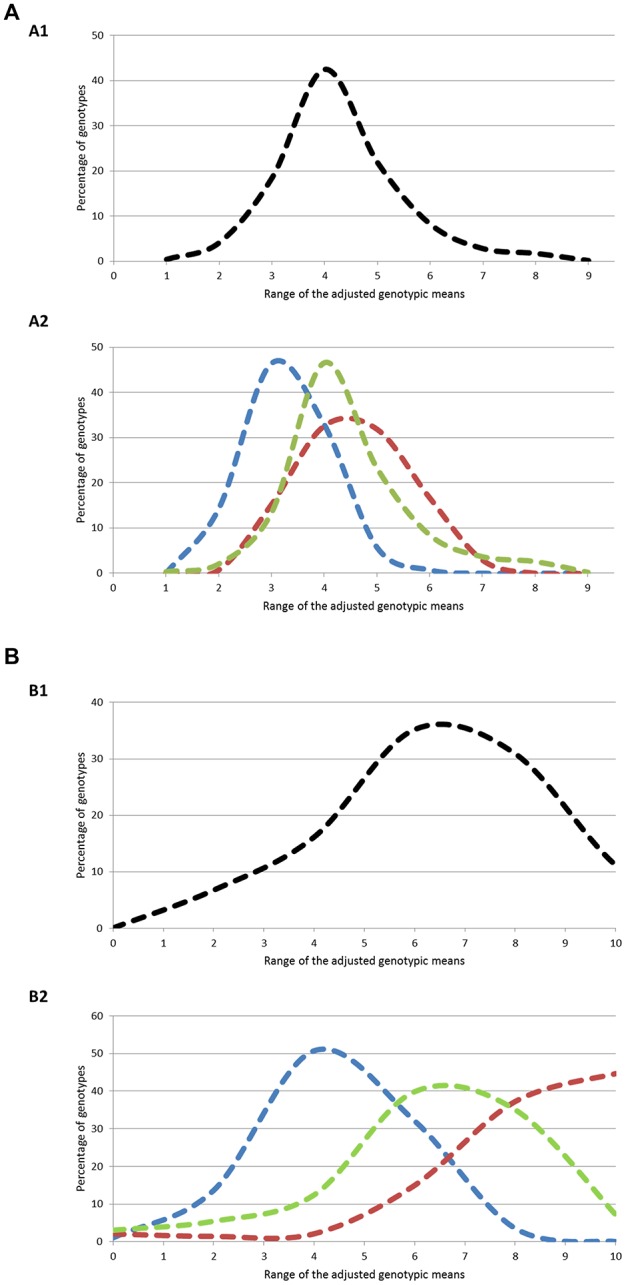
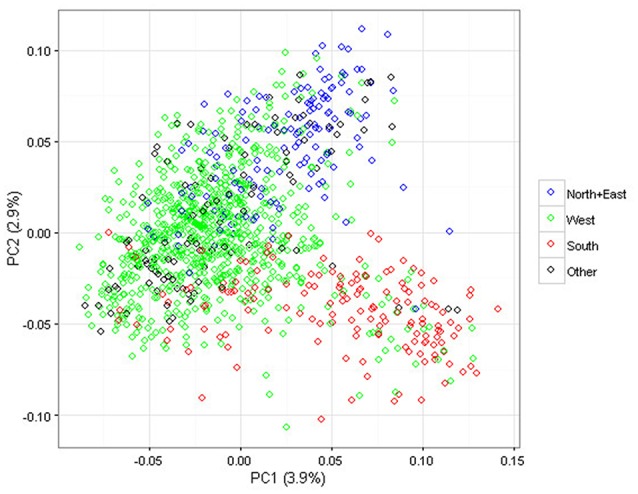
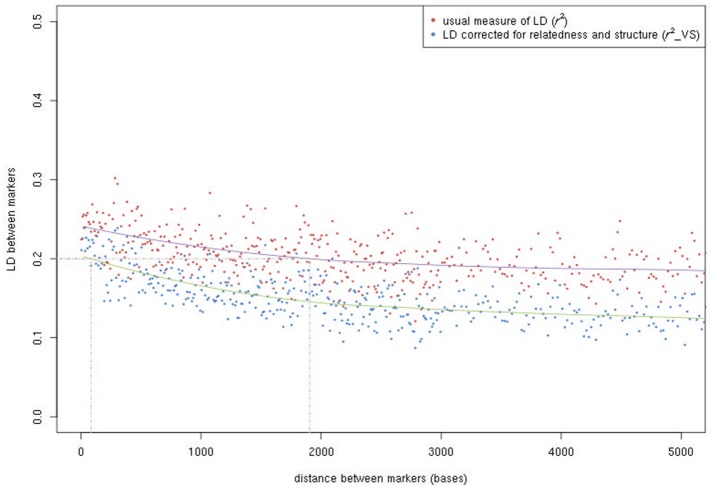
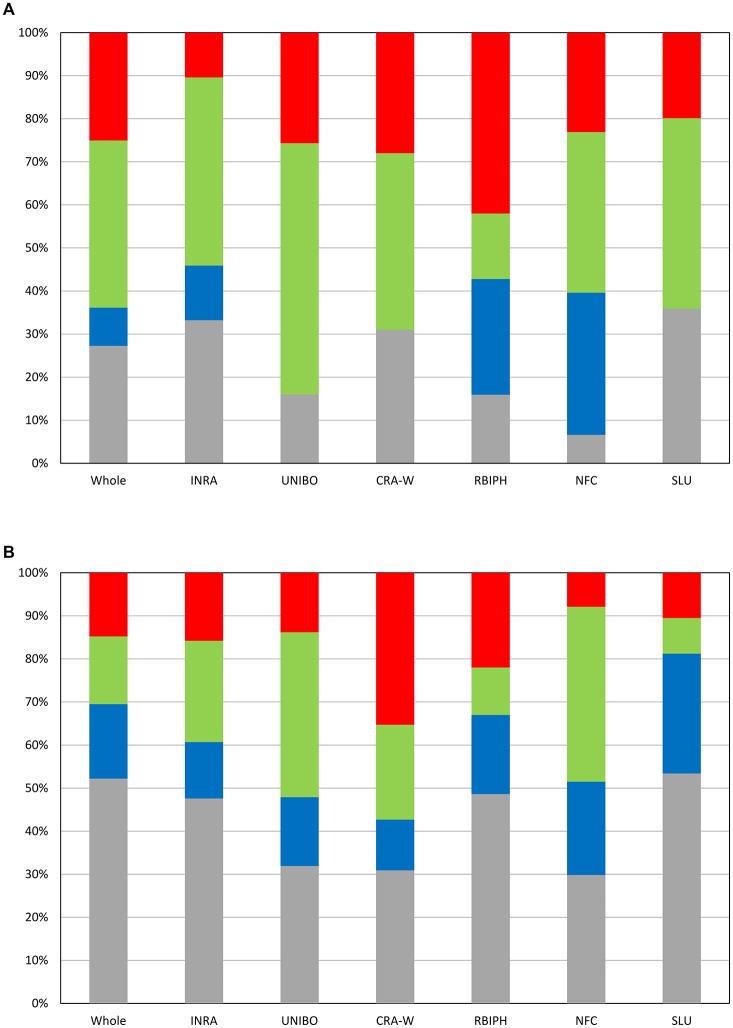
Deciphering the genetic control of flowering and ripening periods in apple is essential for breeding cultivars adapted to their growing environments. We implemented a large Genome-Wide Association Study (GWAS) at the European level using an association panel of 1,168 different apple genotypes distributed over six locations and phenotyped for these phenological traits. The panel was genotyped at a high-density of SNPs using the Axiom®Apple 480 K SNP array. We ran GWAS with a multi-locus mixed model (MLMM), which handles the putatively confounding effect of significant SNPs elsewhere on the genome. Genomic regions were further investigated to reveal candidate genes responsible for the phenotypic variation. At the whole population level, GWAS retained two SNPs as cofactors on chromosome 9 for flowering period, and six for ripening period (four on chromosome 3, one on chromosome 10 and one on chromosome 16) which, together accounted for 8.9 and 17.2% of the phenotypic variance, respectively. For both traits, SNPs in weak linkage disequilibrium were detected nearby, thus suggesting the existence of allelic heterogeneity. The geographic origins and relationships of apple cultivars accounted for large parts of the phenotypic variation. Variation in genotypic frequency of the SNPs associated with the two traits was connected to the geographic origin of the genotypes (grouped as North+East, West and South Europe), and indicated differential selection in different growing environments. Genes encoding transcription factors containing either NAC or MADS domains were identified as major candidates within the small confidence intervals computed for the associated genomic regions. A strong microsynteny between apple and peach was revealed in all the four confidence interval regions. This study shows how association genetics can unravel the genetic control of important horticultural traits in apple, as well as reduce the confidence intervals of the associated regions identified by linkage mapping approaches. Our findings can be used for the improvement of apple through marker-assisted breeding strategies that take advantage of the accumulating additive effects of the identified SNPs.
Keywords: GWAS; Malus × domestica Borkh.; SNP; adaptive traits; association genetics; germplasm collection; microsynteny; quantitative trait loci.
Figures
Similar articles
-
Novel genomic approaches unravel genetic architecture of complex traits in apple.BMC Genomics. 2013 Jun 12;14:393. doi: 10.1186/1471-2164-14-393. BMC Genomics. 2013. PMID: 23758946 Free PMC article.
-
Development and validation of a 20K single nucleotide polymorphism (SNP) whole genome genotyping array for apple (Malus × domestica Borkh).PLoS One. 2014 Oct 10;9(10):e110377. doi: 10.1371/journal.pone.0110377. eCollection 2014. PLoS One. 2014. PMID: 25303088 Free PMC article.
-
Analysis of the genetic diversity and structure across a wide range of germplasm reveals prominent gene flow in apple at the European level.BMC Plant Biol. 2016 Jun 8;16(1):130. doi: 10.1186/s12870-016-0818-0. BMC Plant Biol. 2016. PMID: 27277533 Free PMC article.
-
An integrated approach for increasing breeding efficiency in apple and peach in Europe.Hortic Res. 2018 Mar 1;5:11. doi: 10.1038/s41438-018-0016-3. eCollection 2018. Hortic Res. 2018. PMID: 29507735 Free PMC article. Review.
-
Research Progress on Genetic Basis of Fruit Quality Traits in Apple (Malus × domestica).Front Plant Sci. 2022 Jul 14;13:918202. doi: 10.3389/fpls.2022.918202. eCollection 2022. Front Plant Sci. 2022. PMID: 35909724 Free PMC article. Review.
Cited by
-
I Want to (Bud) Break Free: The Potential Role of DAM and SVP-Like Genes in Regulating Dormancy Cycle in Temperate Fruit Trees.Front Plant Sci. 2019 Jan 10;9:1990. doi: 10.3389/fpls.2018.01990. eCollection 2018. Front Plant Sci. 2019. PMID: 30687377 Free PMC article. Review.
-
Multi-scale high-throughput phenotyping of apple architectural and functional traits in orchard reveals genotypic variability under contrasted watering regimes.Hortic Res. 2019 May 1;6:52. doi: 10.1038/s41438-019-0137-3. eCollection 2019. Hortic Res. 2019. PMID: 31044079 Free PMC article.
-
Genome-wide SNP identification in Prunus rootstocks germplasm collections using Genotyping-by-Sequencing: phylogenetic analysis, distribution of SNPs and prediction of their effect on gene function.Sci Rep. 2020 Jan 30;10(1):1467. doi: 10.1038/s41598-020-58271-5. Sci Rep. 2020. PMID: 32001784 Free PMC article.
-
Comprehensive genetic diversity and genome-wide association studies revealed the genetic basis of avocado fruit quality traits.Front Plant Sci. 2024 Aug 13;15:1433436. doi: 10.3389/fpls.2024.1433436. eCollection 2024. Front Plant Sci. 2024. PMID: 39193209 Free PMC article.
-
Genetic architecture and genomic predictive ability of apple quantitative traits across environments.Hortic Res. 2022 Feb 19;9:uhac028. doi: 10.1093/hr/uhac028. Online ahead of print. Hortic Res. 2022. PMID: 35184165 Free PMC article.
References
-
- Abbott A. G., Zhebentyayeva T., Barakat A., Liu Z. (2015). The genetic control of bud-break in trees, in Advances in Botanical Research, Vol. 74, eds Christophe P., Anne-Françoise A. B. (San Diego, CA: Academic Press; ), 201–228.
LinkOut - more resources
Full Text Sources
Other Literature Sources
Miscellaneous