. 2017 Nov 15:14:22.
doi: 10.1186/s12979-017-0103-6. eCollection 2017.

Immunosenescence in persons with spinal cord injury in relation to urinary tract infections -a cross-sectional study

Affiliations

Immunosenescence in persons with spinal cord injury in relation to urinary tract infections -a cross-sectional study

David Pavlicek et al. Immun Ageing. .

Abstract

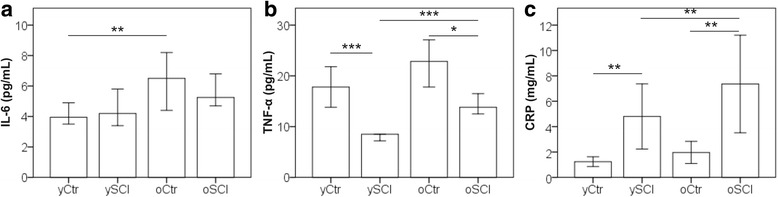
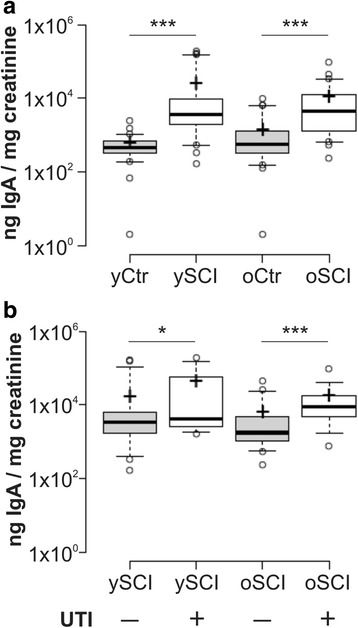
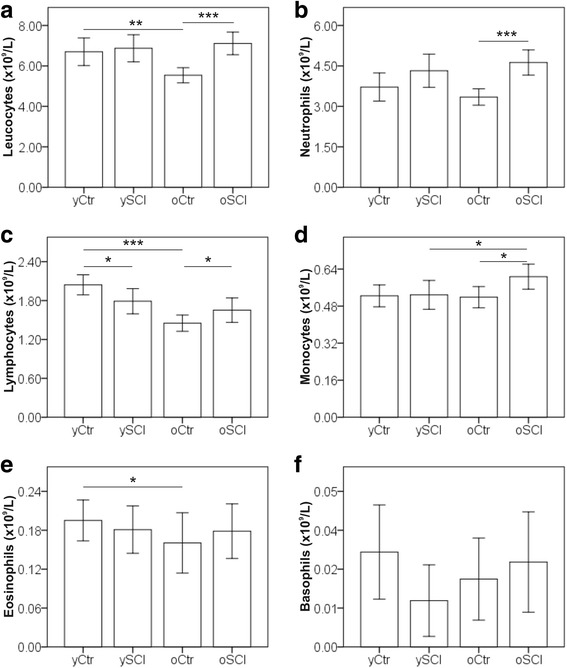
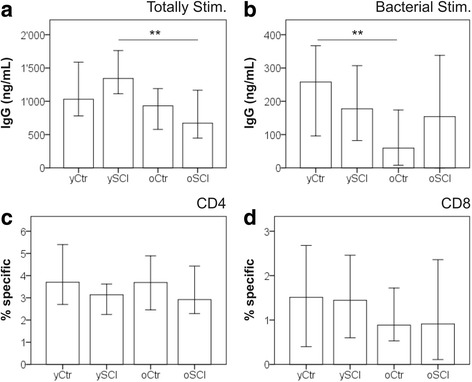
Background: Individuals with a spinal cord injury (SCI), despite specialized rehabilitation and good health care, have a reduced life expectancy. Infectious diseases, such as pneumonias, infected pressure sores and urinary tract infections (UTI) have been identified as the leading causes of mortality. We hypothesise that a premature onset of immune frailty occurs in SCI, possibly caused also by recurrent urinary tract infections.A cross sectional study was performed comparing blood and urine samples between able bodied controls (n = 84) and persons with spinal cord injury (n = 85). The results were grouped according to age (below and above 60 years). Assessed were the abundancies of immune cells, the concentration of soluble biomarkers, the in vitro functioning of lymphocytes as well as phenotypic exhaustion of T-cells in blood and urine. Further, the leucocyte telomere length and the cytomegalovirus (CMV) serological status were compared between the groups.

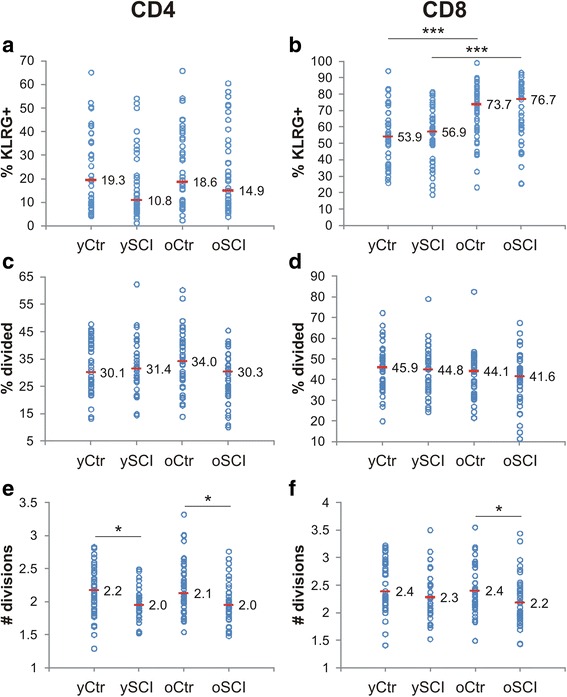
Results: We observed in people with SCI lower proportions of naïve T-cells, more memory T-cells, reduced T-cell proliferation and higher CMV prevalence compared to age-matched controls. SCI participants older than 60 years had a higher prevalence of UTI compared with SCI persons younger than 60 years.

Conclusion: The immune system of people with SCI shows traits of an increased immunological strain and a premature onset of immune frailty. The role of UTI in the onset of immune frailty remains to be elucidated as we did not see significantly higher abundancies of circulating UTI-bacteria specific T-cell clones in persons with SCI. We assume that any impact of UTI on the immune system might be compartmentalized and locally restricted to the urinary tract.

Keywords: Cytomegalovirus; Immune frailty; Immunosenescence; Memory T-cell; Spinal cord injury; Urinary tract infection.


Conflict of interest statement

Ethics approval and consent to participate

The study was approved by the “Nordwest- und Zentralschweiz (EKNZ)” ethics committee (reference no. 13084). Written informed consent was obtained from each study participant.

Consent for publication

Not applicable

Competing interests

The authors declare that they have no competing interests.

Publisher’s Note

Springer Nature remains neutral with regard to jurisdictional claims in published maps and institutional affiliations.

Figures

Fig. 1
Fig. 1
Inflamm-ageing markers among study participants. Inflamm-ageing status was assessed by measuring plasma IL-6 (a), plasma TNF-α (b) and serum CRP (c) levels in the four study groups: able bodied controls <60 years (yCtr, n = 42), SCI < 60 years (ySCI, n = 41), able bodied controls ≥60 years (oCtr, n = 42) and SCI ≥ 60 years (oSCI, n = 42). Results shown represent the median value for IL-6 and TNF-α and the mean value for CRP. Error bars mark the 95% confidence intervals. Significant differences are indicated as *: p < 0.05, **: p < 0.01 and *** p < 0.001
Fig. 2
Fig. 2
Urine IgA concentrations in study participants. The upper panel (a) shows the urine IgA log-values normalized to urine creatinine concentrations for the four groups: able bodied controls <60 years (yCtr, n = 42), SCI < 60 years (ySCI, n = 42), able bodied controls ≥60 years (oCtr, n = 42) and SCI ≥ 60 years (oSCI, n = 43). The bottom panel (b) shows the urine IgA log-values normalized to urine creatinine concentrations for the four groups: SCI < 60 years without active urinary tract infection (UTI) (yCtr, UTI-, n = 28), SCI < 60 years with an active UTI (ySCI, UTI+, n = 14), SCI ≥ 60 years without UTI (oSCI, UTI-, n = 24) and SCI ≥ 60 years with UTI (oSCI, UTI+, n = 19). Significant differences are indicated as *: p < 0.05 and *** p < 0.001
Fig. 3
Fig. 3
Leucocyte differential counts in study participants. Mean cell concentrations for leucocytes (a), neutrophils (b), lymphocytes (c), monocytes (d), eosinophils (e) and basophils (f) are shown for the four groups: able bodied controls <60 years (yCtr, n = 42), SCI < 60 years (ySCI, n = 42), able bodied controls ≥60 years (oCtr, n = 42) and SCI ≥ 60 years (oSCI, n = 43). Error bars mark the 95% confidence intervals. Significant differences are indicated as *: p < 0.05, **: p < 0.01 and *** p < 0.001
Fig. 4
Fig. 4
In vitro functional assays of B-cells, T-cells and UTI burden. Median IgG concentrations were measured at day 7 in the supernatants of (a) totally stimulated PBL (cultured with IL-2, IL-10, IL-21, pokeweed mitogen and CpG rich DNA sequence) and (b) stimulated, with antigens from UTI bacteria (mix of inactivated E.coli, Staph. aureus, Klebsiella pneumonia, Enterococcus spec. And Proteus vulgaris). The bottom panels depict the median abundancies of antigen specific CD4 (c) and CD8 (d) T-cells as measured as cells with upregulated surface activation markers (CD69 and CD137) after four days of stimulation with UTI bacteria antigens. Participants were split into four groups: able bodied controls <60 years (yCtr, n = 41), SCI < 60 years (ySCI, n = 42), able bodied controls ≥60 years (oCtr, n = 42) and SCI ≥ 60 years (oSCI, n = 41). Error bars mark the 95% confidence interval. Significant differences are indicated as **: p < 0.01
Fig. 5
Fig. 5
In vitro T-cell exhaustion and proliferation. The top row shows the expression of the surface exhaustion marker “killer cell lectin-like receptor G1” (KLRG) as determined by flow cytometry for CD4 (a) and CD8 (b) T-cells (n = 41, 42, 42 and 41). The bottom four graphs show the results of a 7 days in vitro stimulation of PBL with the mitogen PHA. Middle row depicts the percent of CD4 (c) and CD8 (d) T-cells which divided at least once or more (n = 41, 39, 35 and 39). Bottom row represents the results for the average number of cell divisions for CD4 (e) and CD8 (f) T-cells after a 7 day in vitro assay with PHA (n = 41, 39, 35 and 39). The horizontal mark indicates the median of each group: able bodied controls <60 years (yCtr), SCI < 60 years (ySCI), able bodied controls ≥60 years (oCtr) and SCI ≥ 60 years (oSCI). Significant differences are indicated as *: p < 0.05 and *** p < 0.001

References

    1. Savic G, DeVivo MJ, Frankel HL, Jamous MA, Soni BM, Charlifue S. Long-term survival after traumatic spinal cord injury: a 70-year British study. Spinal Cord. 2017; - PubMed
    1. Spinal Cord Injury . The National Academies Press. 2005. Progress, promise, and priorities.
    1. National Spinal Cord Injury Statistical Center [https://www.nscisc.uab.edu/]. - PubMed
    1. Nash MS. Known and plausible modulators of depressed immune functions following spinal cord injuries. J Spinal Cord Med. 2000;23:111–120. doi: 10.1080/10790268.2000.11753518. - DOI - PubMed
    1. Whiteneck GG. Aging with spinal cord injury. New York: Demos Medical Publishing; 1993.