. 2017 Oct 3;3(10):e000135.
doi: 10.1099/mgen.0.000135. eCollection 2017 Oct.

Patchy promiscuity: machine learning applied to predict the host specificity of Salmonella enterica and Escherichia coli

Affiliations

Patchy promiscuity: machine learning applied to predict the host specificity of Salmonella enterica and Escherichia coli

Nadejda Lupolova et al. Microb Genom. .

Erratum in

Abstract

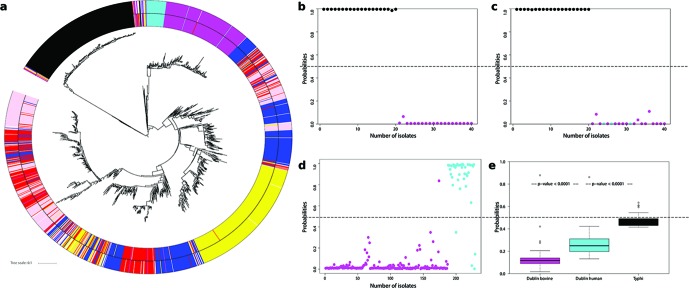
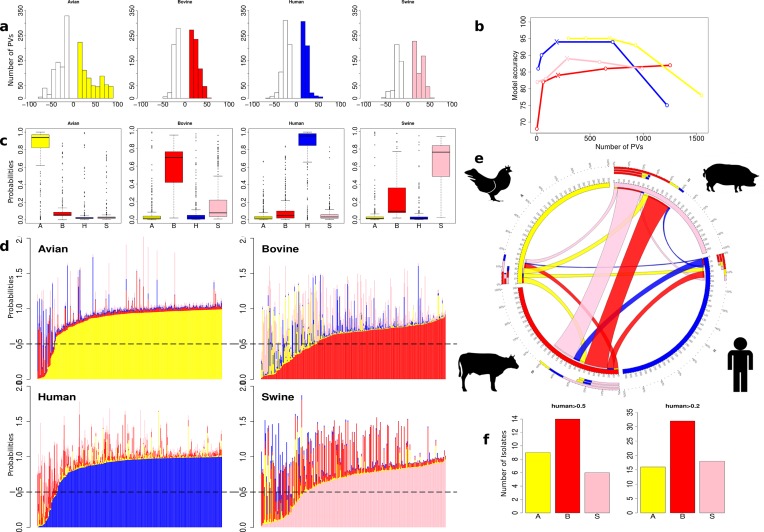
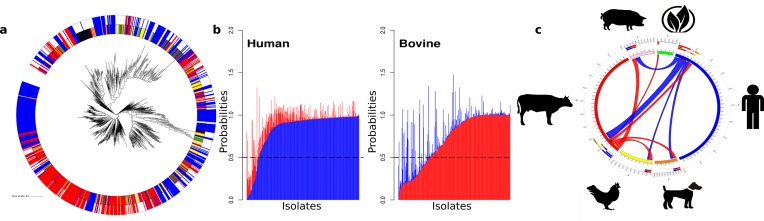
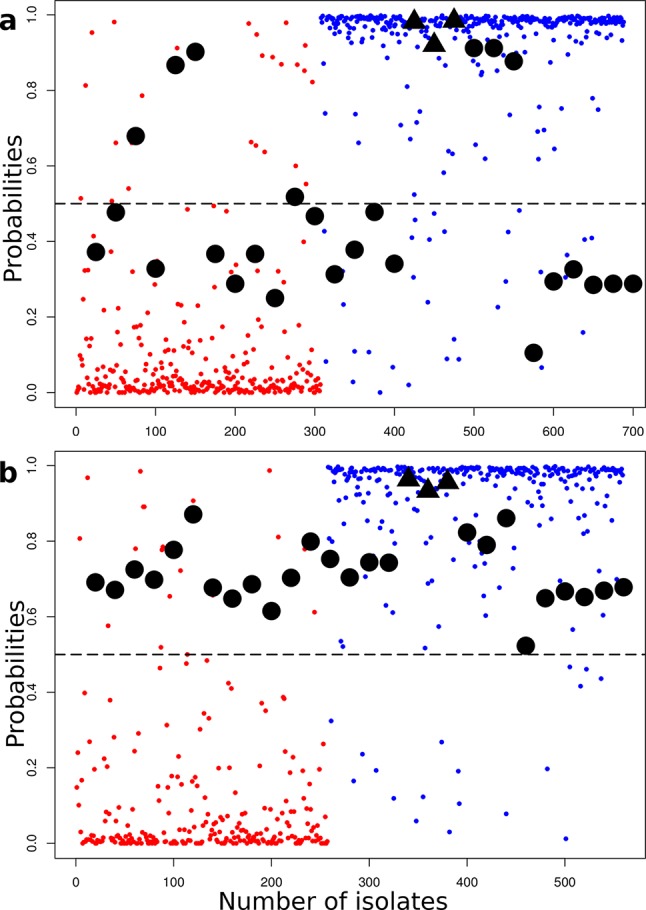
Salmonella enterica and Escherichia coli are bacterial species that colonize different animal hosts with sub-types that can cause life-threatening infections in humans. Source attribution of zoonoses is an important goal for infection control as is identification of isolates in reservoir hosts that represent a threat to human health. In this study, host specificity and zoonotic potential were predicted using machine learning in which Support Vector Machine (SVM) classifiers were built based on predicted proteins from whole genome sequences. Analysis of over 1000 S.enterica genomes allowed the correct prediction (67 -90 % accuracy) of the source host for S. Typhimurium isolates and the same classifier could then differentiate the source host for alternative serovars such as S. Dublin. A key finding from both phylogeny and SVM methods was that the majority of isolates were assigned to host-specific sub-clusters and had high host-specific SVM scores. Moreover, only a minor subset of isolates had high probability scores for multiple hosts, indicating generalists with genetic content that may facilitate transition between hosts. The same approach correctly identified human versus bovine E. coli isolates (83 % accuracy) and the potential of the classifier to predict a zoonotic threat was demonstrated using E. coli O157. This research indicates marked host restriction for both S. enterica and E. coli, with only limited isolate subsets exhibiting host promiscuity by gene content. Machine learning can be successfully applied to interrogate source attribution of bacterial isolates and has the capacity to predict zoonotic potential.

Keywords: E. coli; Salmonella; Support Vector Machine; host specificity; machine learning; zoonosis.


Figures

Fig. 1.
Fig. 1.
Host association of Salmonella enterica. Colour scheme of serovars: Typhi (black); Dublin-bovine (magenta); Dublin-human (cyan); STm avian (yellow); STm bovine (red); STm human (blue); STm swine (pink). (a) Clustering of isolates based on accessory genome content (non-core): distinct branches are evident for Typhi and Dublin serovars. Inside of STm there is some clustering associated with host; the majority of avian isolates cluster together, 80 % of the human isolates cluster in three groups, while the bovine and swine isolates are mostly found in groups of mixed origin. The outer ring shows the SVM host prediction when >0.5 (see Methods) and is otherwise left blank. (b) SVM prediction of Salmonella Typhi (human) vs serovar Dublin (bovine). Twenty isolates were randomly taken from each serovar for testing, and the model was trained on the remaining sequences (230 Typhi-human, 167 Dublin-bovine). Prediction was 100 % accurate due to highly discriminatory PVs (∆PV90=1349, ∆PV100=8). (c) The SVM classifier in (b) was applied to serovar Dublin isolates from both cattle (magenta) and humans (cyan): this primarily discriminates the serovar not the host as there is still complete separation between Typhi (black) and Dublin serovars (cyan and magenta). (d) If predictions were based on training with only Dublin human and bovine information then the Dublin isolates can be separated by this classification. (e) In this case STm bovine and human isolates were used as the training sets and testing was carried out on the distinct serovars: Dublin-bovine, Dublin-human and Typhi-human. Notably, the three groups can now be separated by the STm classifier in a logical trend based on isolation host.
Fig. 2.
Fig. 2.
Host prediction by SVM for STm. Colour scheme: STm-avian (yellow); STm-bovine (red); STm-human (blue); STm-swine (pink). (a) The number of and differential PVs on which predictions were based for each host. PVs that differed by less than 10 are not shown (see Methods). The coloured bars are the number of PVs that are present in higher levels in the specified host group, while white bars are the number of PVs more abundant in the ‘all other’ population. (b) Graph showing the relationship between the number of PVs and model accuracy for each host group. Individual points relate to the number of PVs at different ∆PV thresholds from ∆PV>10 to ∆PV>50, plotted from right to left. Crosses define the number of PVs and model accuracy at ∆PV>30, which was applied in the study. (c) Probability assignments of isolate genome content to each host. All STm isolates were tested for their score assignment to each host, expressed as a probability. The sources of the majority of the isolates were predicted correctly, although some hosts have isolates that were more likely to contain genetic information that overlapped with another host. (d) SVM-assigned probabilities for each host plotted for each isolate as a stacked bar. This allows a comparison of the level of host specificity for each isolate. (e) Circos plot depicting the proportion of STm sequence features from each host that can be found in another host. For example, 51 swine isolates with strong porcine prediction scores (>0.5) also had high (>0.5) scores for genetic features from bovine isolates and these are shown as a pink ribbon going from the swine host to bovine host. In total, 52 bovine isolates had a high (>0.5) swine signal and are depicted with a red ribbon going from cattle to swine. The outer ring plots these data as the percentage of isolates assigned other host scores for each specific host. (f) STm isolates scored as human from the different hosts. For each STm isolate the probability of belonging to the human training group was assessed. With a threshold probability of 0.5, there were: nine avian (3 %), 14 bovine (5 %) and six swine (2 %) isolates. When the threshold was set at 0.2, there were 16 avian (5 %), 32 bovine (11 %) and 18 swine (7 %). At this threshold the higher proportion of cattle isolates with human isolate features is significant (Fisher’s exact test: P=0.035).
Fig. 3.
Fig. 3.
Accessory genome analysis and host prediction by SVM for E. coli. Colour scheme: avian (yellow); bovine (red); human (blue); swine (pink). (a) Accessory genome tree based on PVs: some clustering by host for human and bovine isolates was evident. The outer ring indicates the position and isolation host of isolates incorrectly called as human by SVM analysis. (b) SVM host assignment probabilities for human and bovine hosts. The probabilities for each isolate are plotted as stacked bars. (c) The proportions of isolates from each host with human or bovine features.
Fig. 4.
Fig. 4.
Host assignment of an established bacterial zoonosis: E. coli O157. Colour scheme: human (blue) and bovine (red). E. coli isolates from both cattle and humans are plotted with their predicted host assignment probability. All these isolates were used as a training dataset to determine host assignment probabilities for O157 isolates (black circles) and three Shigella isolates (black triangles). (a) Training set containing stx+E. coli isolates but not serovar O157, and host assignment probability was then predicted for an O157 test group. (b) Training set with all stx-positive isolates removed and the host assigned for the same E. coli O157 test group. In both cases the E. coli O157 isolates, irrespective of their isolation host, score as containing mixed genetic information in relation to the training set of human and bovine E. coli isolates, indicating transmission/zoonotic potential.

References

    1. Kaper JB, Nataro JP, Mobley HL. Pathogenic Escherichia coli . Nat Rev Microbiol. 2004;2:123–140. doi: 10.1038/nrmicro818. - DOI - PubMed
    1. Chaudhuri RR, Henderson IR. The evolution of the Escherichia coli phylogeny. Infect Genet Evol. 2012;12:214–226. doi: 10.1016/j.meegid.2012.01.005. - DOI - PubMed
    1. Langridge GC, Fookes M, Connor TR, Feltwell T, Feasey N, et al. Patterns of genome evolution that have accompanied host adaptation in Salmonella . Proc Natl Acad Sci USA. 2015;112:863–868. doi: 10.1073/pnas.1416707112. - DOI - PMC - PubMed
    1. Bäumler A, Fang FC. Host specificity of bacterial pathogens. Cold Spring Harb Perspect Med. 2013;3:a010041. doi: 10.1101/cshperspect.a010041. - DOI - PMC - PubMed
    1. Okoro CK, Barquist L, Connor TR, Harris SR, Clare S, et al. Signatures of adaptation in human invasive Salmonella Typhimurium ST313 populations from sub-Saharan Africa. PLoS Negl Trop Dis. 2015;9:e0003611. doi: 10.1371/journal.pntd.0003611. - DOI - PMC - PubMed

Publication types