Ultrasmall Superparamagnetic Iron Oxide Imaging Identifies Tissue and Nerve Inflammation in Pain Conditions
- PMID: 29177411
- PMCID: PMC6659016
- DOI: 10.1093/pm/pnx267
Ultrasmall Superparamagnetic Iron Oxide Imaging Identifies Tissue and Nerve Inflammation in Pain Conditions
Abstract
Objective: Correlation between radiologic structural abnormalities and clinical symptoms in low back pain patients is poor. There is an unmet clinical need to image inflammation in pain conditions to aid diagnosis and guide treatment. Ferumoxytol, an ultrasmall superparamagnetic iron oxide (USPIO) nanoparticle, is clinically used to treat iron deficiency anemia and showed promise in imaging tissue inflammation in human. We explored whether ferumoxytol can be used to identify tissue and nerve inflammation in pain conditions in animals and humans.
Methods: Complete Freud's adjuvant (CFA) or saline was injected into mice hind paws to establish an inflammatory pain model. Ferumoxytol (20 mg/kg) was injected intravenously. Magnetic resonance imaging (MRI) was performed prior to injection and 72 hours postinjection. The changes in the transverse relaxation time (T2) before and after ferumoxytol injection were compared between mice that received CFA vs saline injection. In the human study, we administered ferumoxytol (4 mg/kg) to a human subject with clinical symptoms of lumbar radiculopathy and compared the patient with a healthy subject.
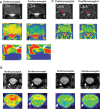
Results: Mice that received CFA exhibited tissue inflammation and pain behaviors. The changes in T2 before and after ferumoxytol injection were significantly higher in mice that received CFA vs saline (20.8 ± 3.6 vs 2.2 ± 2.5, P = 0.005). In the human study, ferumoxytol-enhanced MRI identified the nerve root corresponding to the patient's symptoms, but the nerve root was not impinged by structural abnormalities, suggesting the potential superiority of this approach over conventional structural imaging techniques.
Conclusions: Ferumoxytol-enhanced MRI can identify tissue and nerve inflammation and may provide a promising diagnostic tool in assessing pain conditions in humans.
Figures


Similar articles
-
Ultrasmall superparamagnetic iron oxide nanoparticle uptake as noninvasive marker of aortic wall inflammation on MRI: proof of concept study.Br J Radiol. 2018 Dec;91(1092):20180461. doi: 10.1259/bjr.20180461. Epub 2018 Sep 12. Br J Radiol. 2018. PMID: 30160173 Free PMC article.
-
Comparison of Three Ultrasmall, Superparamagnetic Iron Oxide Nanoparticles for MRI at 3.0 T.J Magn Reson Imaging. 2023 Jun;57(6):1819-1829. doi: 10.1002/jmri.28457. Epub 2022 Oct 17. J Magn Reson Imaging. 2023. PMID: 36250695 Free PMC article.
-
Ferumoxytol administration does not alter infarct volume or the inflammatory response to stroke in mice.Neurosci Lett. 2015 Jan 1;584:236-40. doi: 10.1016/j.neulet.2014.10.041. Epub 2014 Nov 1. Neurosci Lett. 2015. PMID: 25449870 Free PMC article.
-
USPIO-Enhanced MRI Neuroimaging: A Review.J Neuroimaging. 2016 Mar-Apr;26(2):161-8. doi: 10.1111/jon.12318. Epub 2015 Dec 3. J Neuroimaging. 2016. PMID: 26932522 Review.
-
Emerging applications for ferumoxytol as a contrast agent in MRI.J Magn Reson Imaging. 2015 Apr;41(4):884-98. doi: 10.1002/jmri.24691. Epub 2014 Jun 30. J Magn Reson Imaging. 2015. PMID: 24974785 Review.
Cited by
-
A comprehensive review on the applications of ferrite nanoparticles in the diagnosis and treatment of breast cancer.Med Oncol. 2024 Jan 10;41(2):53. doi: 10.1007/s12032-023-02277-2. Med Oncol. 2024. PMID: 38198041 Review.
-
Magnetic Nanoparticles in Biology and Medicine: Past, Present, and Future Trends.Pharmaceutics. 2021 Jun 24;13(7):943. doi: 10.3390/pharmaceutics13070943. Pharmaceutics. 2021. PMID: 34202604 Free PMC article. Review.
-
Up-and-coming Radiotracers for Imaging Pain Generators.Semin Musculoskelet Radiol. 2023 Dec;27(6):661-675. doi: 10.1055/s-0043-1775745. Epub 2023 Nov 7. Semin Musculoskelet Radiol. 2023. PMID: 37935213 Free PMC article.
-
Peripheral BDNF Regulates Somatosensory-Sympathetic Coupling in Brachial Plexus Avulsion-Induced Neuropathic Pain.Neurosci Bull. 2023 Dec;39(12):1789-1806. doi: 10.1007/s12264-023-01075-0. Epub 2023 Jun 19. Neurosci Bull. 2023. PMID: 37335428 Free PMC article.
-
Effects of Combined Shinbaro and Celecoxib in a Complete Freund's Adjuvant-Induced Inflammatory Pain Mouse Model.J Inflamm Res. 2025 Feb 17;18:2349-2362. doi: 10.2147/JIR.S500345. eCollection 2025. J Inflamm Res. 2025. PMID: 39991659 Free PMC article.
References
-
- el Barzouhi A, Vleggeert-Lankamp CL, Lycklama à Nijeholt GJ et al. , Magnetic resonance imaging in follow-up assessment of sciatica. N Engl J Med 2013;36811:999–1007. - PubMed
Publication types
MeSH terms
Substances
Grants and funding
LinkOut - more resources
Full Text Sources
Other Literature Sources
Medical

