Comparative Study
. 2018 Feb 1;35(2):486-503.
doi: 10.1093/molbev/msx302.

Evaluating Fast Maximum Likelihood-Based Phylogenetic Programs Using Empirical Phylogenomic Data Sets

Affiliations
Comparative Study

Evaluating Fast Maximum Likelihood-Based Phylogenetic Programs Using Empirical Phylogenomic Data Sets

Xiaofan Zhou et al. Mol Biol Evol. .

Abstract

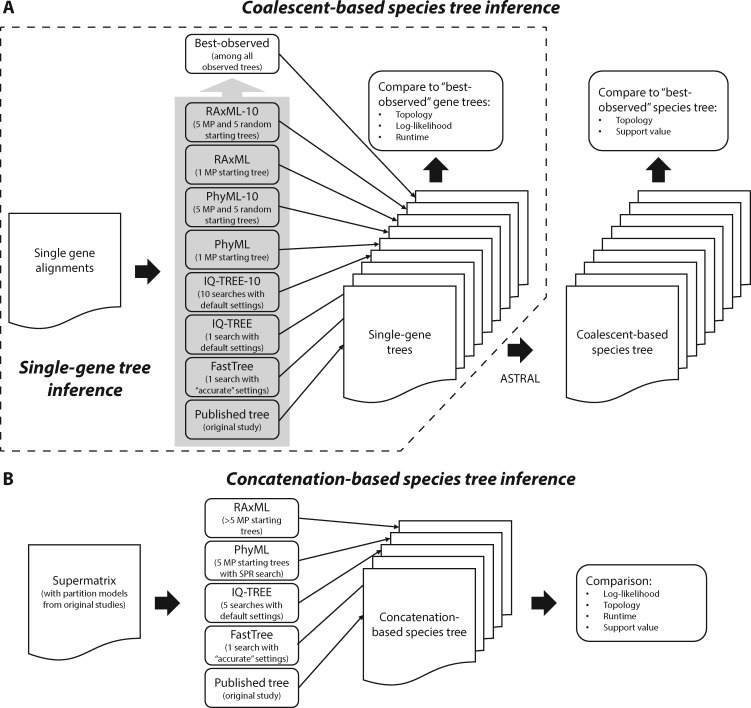
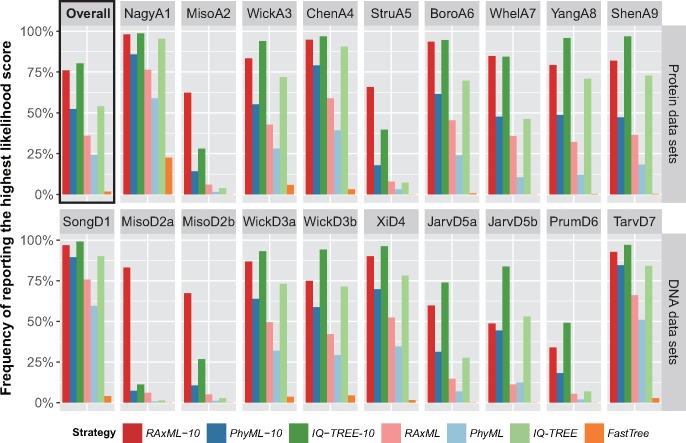
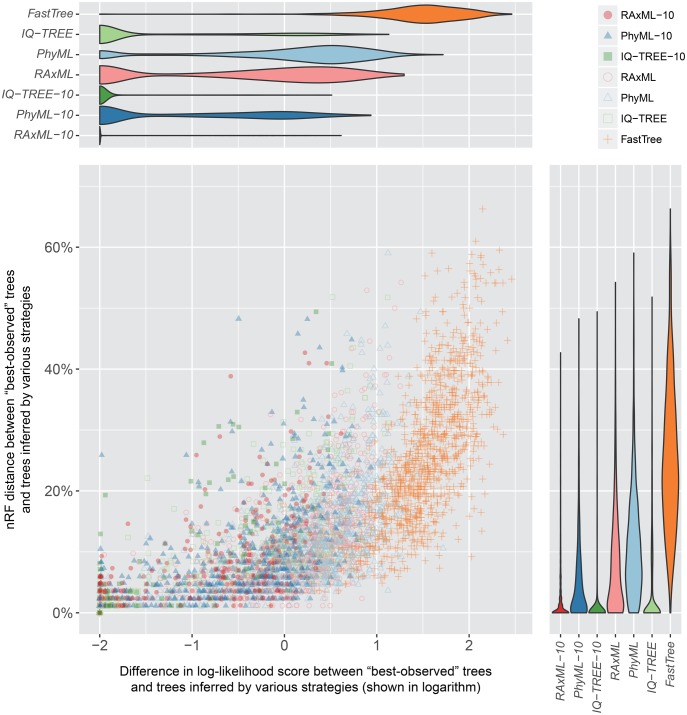
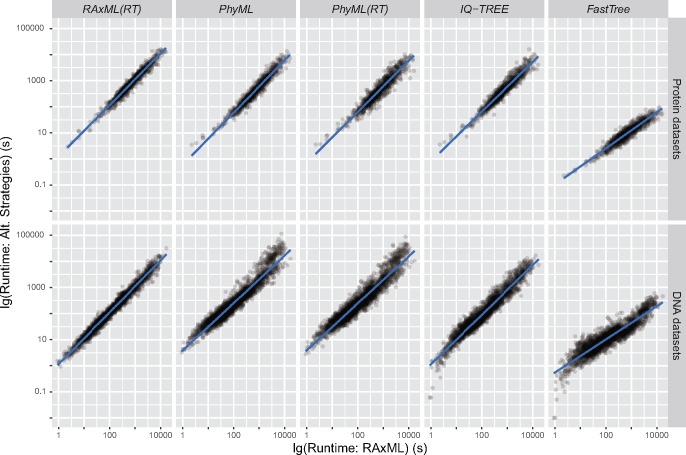
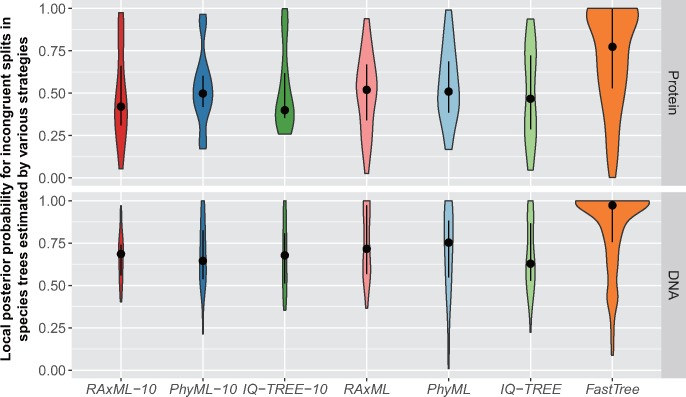
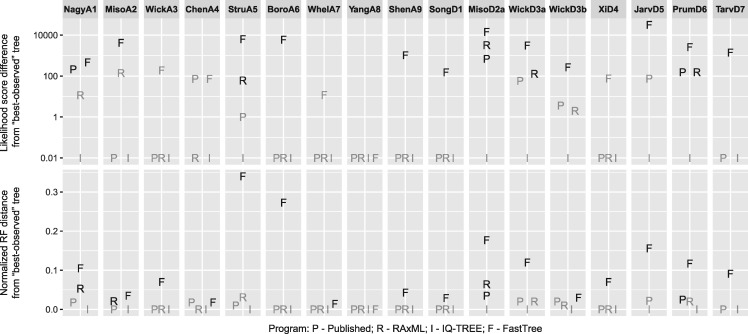
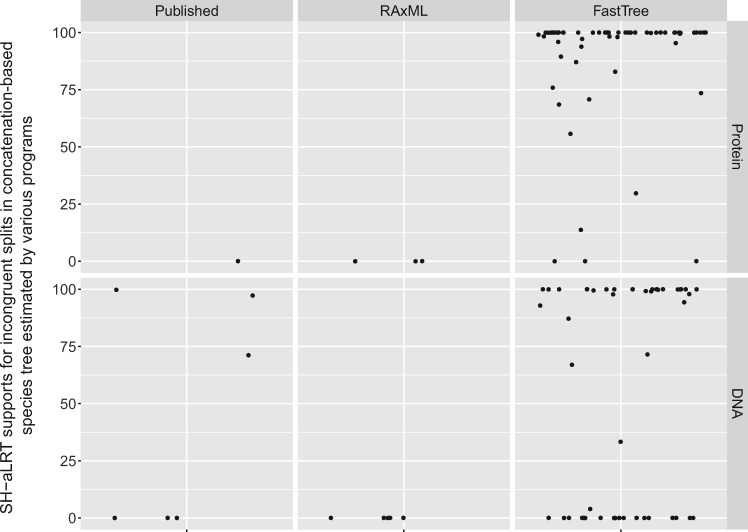
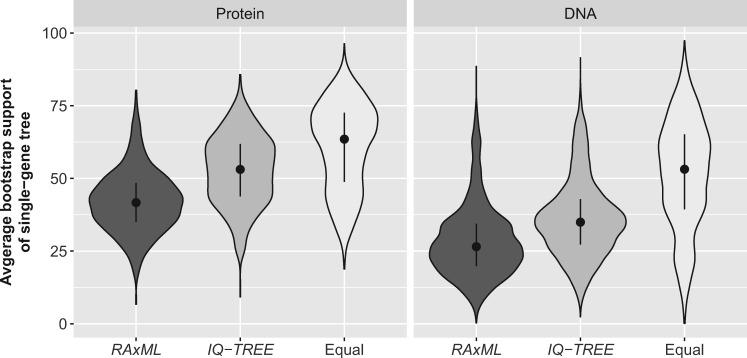
The sizes of the data matrices assembled to resolve branches of the tree of life have increased dramatically, motivating the development of programs for fast, yet accurate, inference. For example, several different fast programs have been developed in the very popular maximum likelihood framework, including RAxML/ExaML, PhyML, IQ-TREE, and FastTree. Although these programs are widely used, a systematic evaluation and comparison of their performance using empirical genome-scale data matrices has so far been lacking. To address this question, we evaluated these four programs on 19 empirical phylogenomic data sets with hundreds to thousands of genes and up to 200 taxa with respect to likelihood maximization, tree topology, and computational speed. For single-gene tree inference, we found that the more exhaustive and slower strategies (ten searches per alignment) outperformed faster strategies (one tree search per alignment) using RAxML, PhyML, or IQ-TREE. Interestingly, single-gene trees inferred by the three programs yielded comparable coalescent-based species tree estimations. For concatenation-based species tree inference, IQ-TREE consistently achieved the best-observed likelihoods for all data sets, and RAxML/ExaML was a close second. In contrast, PhyML often failed to complete concatenation-based analyses, whereas FastTree was the fastest but generated lower likelihood values and more dissimilar tree topologies in both types of analyses. Finally, data matrix properties, such as the number of taxa and the strength of phylogenetic signal, sometimes substantially influenced the programs' relative performance. Our results provide real-world gene and species tree phylogenetic inference benchmarks to inform the design and execution of large-scale phylogenomic data analyses.

Keywords: heuristic search; molecular evolution; topology; tree space.


Figures

<sc>Fig</sc>. 1.
Fig. 1.
Schematics of the (A) single-gene tree inference test as well as the coalescent-based and (B) concatenation-based species tree inference tests used to evaluate the performance of fast phylogenetic programs in phylogenomic analysis.
<sc>Fig</sc>. 2.
Fig. 2.
Performance of fast phylogenetic programs in the inference of single-gene trees. The bar-plots show the frequencies with which each of the seven analysis strategies produced the best likelihoods for single-gene alignments in each of the (A) protein and (B) DNA data sets. Note that the best likelihood score for a given single-gene alignment can be found by more than one strategies; therefore the sum of frequencies for a data set may be greater than one.
<sc>Fig</sc>. 3.
Fig. 3.
The performances of fast phylogenetic programs with respect to likelihood maximization and tree topology are positively correlated. Dots in the scatter plot correspond to trees inferred by various analysis strategies from single-gene alignments in data set YangA8. Log-likelihood score differences between inferred trees and the “best-observed” trees are plotted against the corresponding topological distances. The log-likelihood score differences are shown in logarithmic scale (with the addition of a small value of 0.01). The violin plots on the top and right show the distributions of log-likelihood differences (top) and topological distances (right), respectively, for trees inferred by each strategy.
<sc>Fig</sc>. 4.
Fig. 4.
Runtime comparisons of fast phylogenetic programs in single-gene tree inferences. The runtimes required by each strategy to analyze a randomly selected subset of all protein (top row) and DNA (bottom row) alignments are plotted against the corresponding runtimes of RAxML. All runtimes (in seconds) are shown in logarithmic scale.
<sc>Fig</sc>. 5.
Fig. 5.
Incongruent splits in coalescent-based species trees estimated by the strategies using RAxML, PhyML, and IQ-TREE are weakly supported. The violin plots show the distribution of local posterior probabilities for incongruent splits in coalescent-based species trees estimated by various analysis strategies. Here, incongruent splits are defined as the splits that are not present in species trees estimated from best-observed single-gene trees. The areas of violin plots are proportional to the total numbers of incongruent splits. The gray dots and bars in each violin plot indicate the median and the first/third quartiles of the local posterior probabilities, respectively.
<sc>Fig</sc>. 6.
Fig. 6.
Likelihood score differences and normalized Robinson-Foulds distances between concatenation-based species trees inferred by various fast phylogenetic programs and the best-observed trees. The log-likelihood score differences are shown in logarithmic scale (with the addition of a small value of 0.01), and the likelihood scores that are not significantly different from the best-observed scores are shown in gray. The nRF distances of ExaML/RAxML-published and RAxML-generated trees that can be further improved by NNI rearrangements are shown in gray. In the plots, “P” stands for ExaML/RAxML-published tree, whereas “R,” “I,” and “F” stand for trees inferred by RAxML, IQ-TREE, and FastTree, respectively.
<sc>Fig</sc>. 7.
Fig. 7.
Many incongruent splits in concatenation-based species trees estimated by FastTree receive strong support. The jitter plots show the distribution of SH-aLRT supports for incongruent splits in concatenation-based species trees estimated by various fast phylogenetic programs. Here, incongruent splits are defined as the splits that are not present in the species trees with the best likelihoods. The species trees inferred by IQ-TREE contain no incongruent splits and therefore the data for IQ-TREE is not shown. The SH-aLRT support is a measure of the reliability of splits in a phylogeny; its value ranges from 0 (lack of support) to 100 (maximal support).
<sc>Fig</sc>. 8.
Fig. 8.
Runtime comparisons of fast phylogenetic programs in concatenation-based species tree inferences. The bar-plots show the runtimes (averaged over three replicates) required by RAxML, IQ-TREE, and FastTree to analyze ten selected supermatrices.
<sc>Fig</sc>. 9.
Fig. 9.
The strength of phylogenetic signal in the data has an impact on the relative performance of RAxML-10 and IQ-TREE-10. The violin plots show the distributions of average bootstrap values of alignments for which the best likelihood scores were found by either RAxML-10 or IQ-TREE-10, or both strategies at the same time. The average bootstrap values are taken from previously reported phylogenies for the alignments are used here as a measure of the strength of phylogenetic signal.

References

    1. Borowiec ML, Lee EK, Chiu JC, Plachetzki DC.. 2015. Extracting phylogenetic signal and accounting for bias in whole-genome data sets supports the Ctenophora as sister to remaining Metazoa. BMC Genomics 16:987.. - PMC - PubMed
    1. Bruno WJ, Socci ND, Halpern AL.. 2000. Weighted neighbor joining: a likelihood-based approach to distance-based phylogeny reconstruction. Mol Biol Evol. 171:189–197.http://dx.doi.org/10.1093/oxfordjournals.molbev.a026231 - DOI - PubMed
    1. Bryant D, Galtier N, Poursat M-A.. 2005. Likelihood calculation in molecular phylogenetics In: Gascuel O, editor. Mathematics of evolution and phylogeny. Oxford (UK: ): Oxford University Press; p. 33–62.
    1. Chen MY, Liang D, Zhang P.. 2015. Selecting question-specific genes to reduce incongruence in phylogenomics: a case study of jawed vertebrate backbone phylogeny. Syst Biol. 646:1104–1120.http://dx.doi.org/10.1093/sysbio/syv059 - DOI - PubMed
    1. Chernomor O, von Haeseler A, Minh BQ.. 2016. Terrace aware data structure for phylogenomic inference from supermatrices. Syst Biol. 656: 997–1008.http://dx.doi.org/10.1093/sysbio/syw037 - DOI - PMC - PubMed

Publication types