. 2018 Feb;107(3):344-362.
doi: 10.1111/mmi.13885. Epub 2017 Dec 18.

TbSmee1 regulates hook complex morphology and the rate of flagellar pocket uptake in Trypanosoma brucei

Affiliations

TbSmee1 regulates hook complex morphology and the rate of flagellar pocket uptake in Trypanosoma brucei

Jenna A Perry et al. Mol Microbiol. 2018 Feb.

Abstract

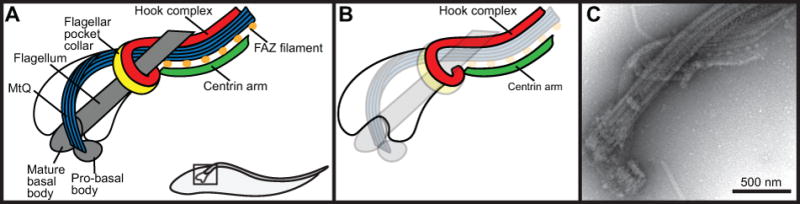
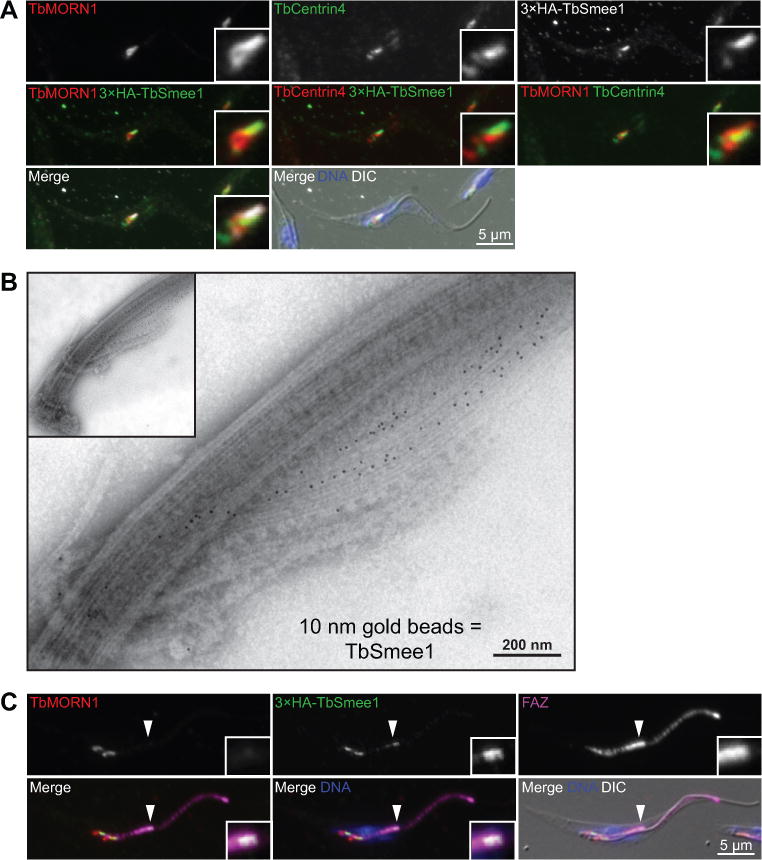
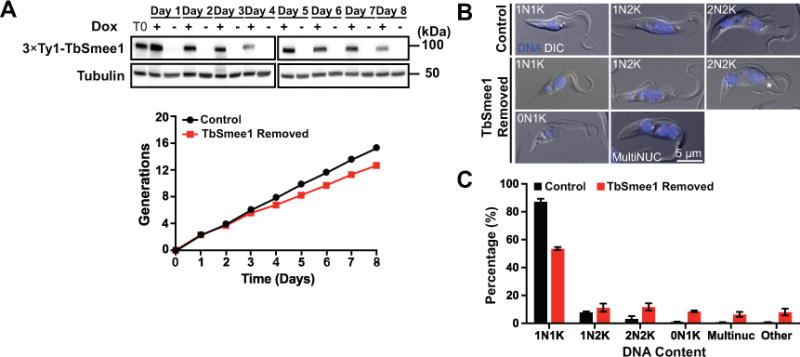
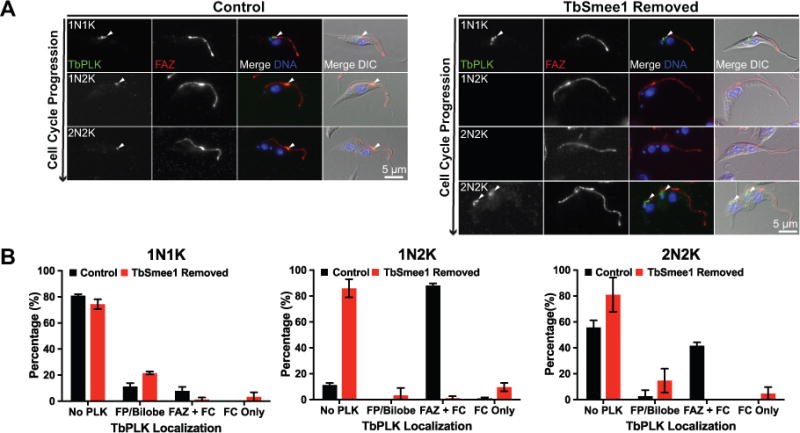
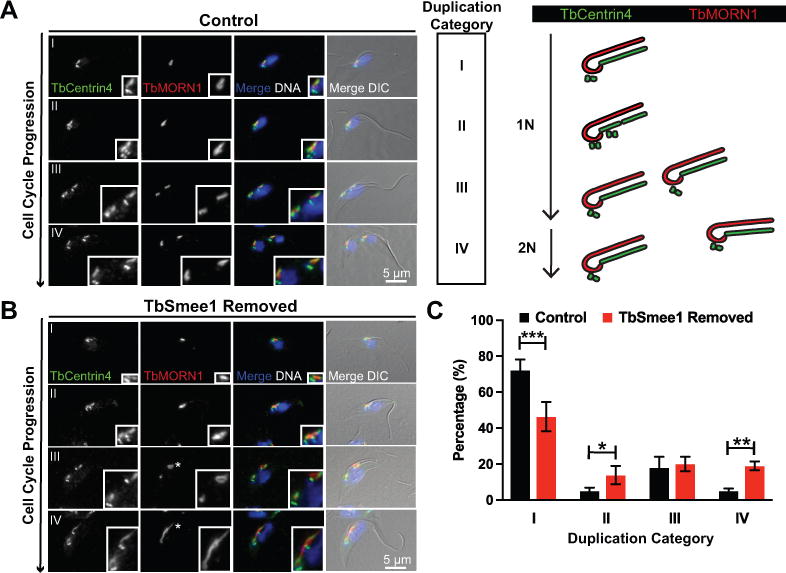
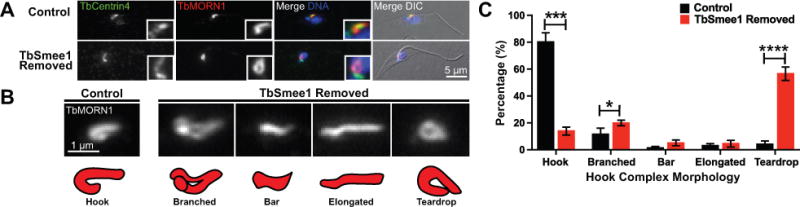
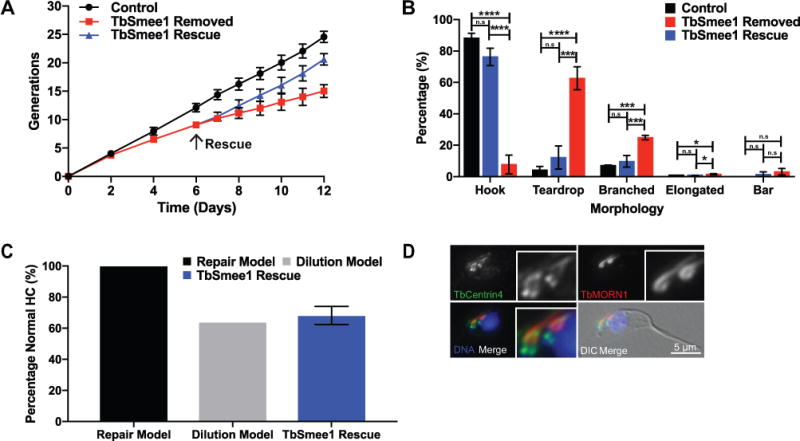
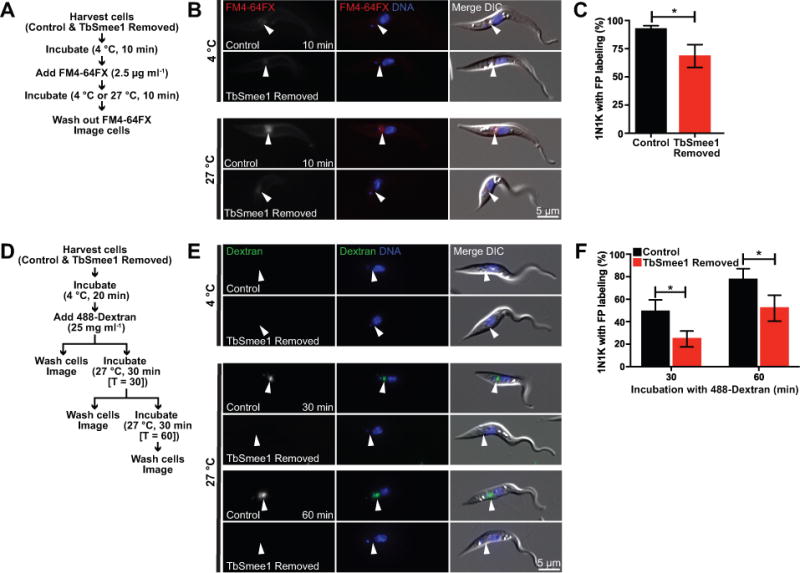
Trypanosoma brucei uses multiple mechanisms to evade detection by its insect and mammalian hosts. The flagellar pocket (FP) is the exclusive site of uptake from the environment in trypanosomes and shields receptors from exposure to the host. The FP neck is tightly associated with the flagellum via a series of cytoskeletal structures that include the hook complex (HC) and the centrin arm. These structures are implicated in facilitating macromolecule entry into the FP and nucleating the flagellum attachment zone (FAZ), which adheres the flagellum to the cell surface. TbSmee1 (Tb927.10.8820) is a component of the HC and a putative substrate of polo-like kinase (TbPLK), which is essential for centrin arm and FAZ duplication. We show that depletion of TbSmee1 in the insect-resident (procyclic) form of the parasite causes a 40% growth decrease and the appearance of multinucleated cells that result from defective cytokinesis. Cells lacking TbSmee1 contain HCs with aberrant morphology and show delayed uptake of both fluid-phase and membrane markers. TbPLK localization to the tip of the new FAZ is also blocked. These results argue that TbSmee1 is necessary for maintaining HC morphology, which is important for the parasite's ability to take up molecules from its environment.


Figures

Figure 1
Figure 1
Representation of key cytoskeletal structures surrounding the T. brucei flagellar pocket. (A) Schematic of flagellar pocket associated cytoskeletal structures. (B) Schematic from left panel highlighting the hook complex and centrin arm. (C) Negative stain electron microscopy of an isolated flagellum
Figure 2
Figure 2
TbSmee1 localizes to the hook complex and the tip of the new FAZ. (A) Cells expressing 3×HA-TbSmee1 fixed and labeled with antibodies against TbMORN1 (TbMORN1; red), TbCentrin4 (TbCentrin4; green, red), and anti-HA (3×HA-TbSmee1; white, green) and DAPI to label the DNA (DNA; blue). The cells were visualized using fluorescence and DIC microscopy. (B) Flagella were isolated from the same cells as in A and labeled with antibodies against TbSmee1 and a secondary antibody conjugated to 10 nm gold particles. The labeled isolated flagella were negatively stained and examined by transmission electron microscopy. (C) The same cells as in A were fixed and labeled with antibodies against TbMORN1 (TbMORN1; red), an antibody against the FAZ (FAZ; magenta), anti-HA (3×HA-TbSmee1; green), and DAPI to label DNA (DNA; blue). The filled arrowhead shows the new FAZ tip in a dividing cell. Insets show threefold magnifications of the area around the tip of the new FAZ.
Figure 3
Figure 3
Depletion of TbSmee1 leads to a slow-growth phenotype and causes a cytokinetic delay. (A) TbSmee1 cKO cells were grown for 8 days in either the presence (+; Control) or absence (-; TbSmee1 Removed) of doxycycline. Cells from each culture were monitored by cell count and collected daily to monitor for TbSmee1 depletion by Ty1 western blotting, using tubulin as a loading control. T0 represents the culture at the start of each experiment. (B) Cells expressing TbSmee1 (Control) and cells depleted of TbSmee1 (TbSmee1 Removed) for 6 days were fixed with PFA and treated with DAPI to label DNA. These cells were evaluated by fluorescence and DIC imaging. Asterisk shows a detached flagellum tip. (C) Quantification of DNA content of TbSmee1-depleted cells (TbSmee1 Removed) and control cells (Control) after 6 days. The “other” category contains a mixed population of multi-kinetoplast cells and nucleus-only cells. Data are means ± SD of three independent experiments.
Figure 4
Figure 4
TbPLK localization is absent from the new FAZ tip when TbSmee1 is depleted. (A) Control cells (Control) and cells depleted of TbSmee1 for 6 days were fixed and labeled with antibodies against TbPLK (TbPLK; green) and FAZ (FAZ; red). DAPI was used to visualize DNA (DNA; blue) and the samples were imaged using fluorescence and DIC microscopy. Arrowheads denote PLK localization. (B) Quantitation of the localization of TbPLK in control and TbSmee1-depleted cells (TbSmee1 Removed) in A, sorted by DNA content. Data are means ± SD of three independent experiments.
Figure 5
Figure 5
TbSmee1 depletion leads to delayed hook complex replication. (A) Control cells were fixed and labeled with antibodies against TbMORN1 (TbMORN1; red) and TbCentrin4 (TbCentrin4; green); DAPI was used to visualize DNA (DNA; blue). Fluorescence and DIC microscopy was used to analyze the cells. Rows depict cells progressing through the cell cycle and indicate stage of hook complex-centrin arm replication as depicted in the schematic representation. (B) Cells depleted of TbSmee1 for 6 days (TbSmee1 Removed) were fixed, antibody labeled, and visualized as above. Asterisk highlights hook complexes that have altered morphology. (C) Quantitation of hook complex-centrin arms from control and TbSmee1-depleted cells (TbSmee1 Removed) found in each duplication stage. Data are the means ±SD of three independent experiments. *, P ≤ 0.05; **, P ≤ 0.01; ***, P≤ 0.001 (multiple unpaired two-tailed Student’s t test).
Figure 6
Figure 6
Depletion of TbSmee1 leads to altered hook complex morphologies. (A) Control cells and TbSmee1-depleted cells (TbSmee1 Removed) were fixed and labeled with an antibody against TbCentrin4 (TbCentrin4; green), antibodies against TbMORN1 (TbMORN1; red), and DAPI to visualize DNA (DNA; blue). A non-dividing 1N1K cell is shown. Insets are threefold magnifications. (B) Six-fold magnifications of TbMORN1-labeled (TbMORN; white) hook complexes with varying morphologies from non-dividing 1N1K control and TbSmee1-depleted cells (TbSmee1 Removed) categorized as shown in the schematic. (C) Quantification of hook complex morphologies in non-dividing 1N1K control and TbSmee1-depleted (TbSmee1 Removed) cells. Data are means ± SD of three independent experiments. *, P ≤ 0.05; ***, P≤ 0.001; ****, P ≤ 0.0001(multiple unpaired two-tailed Student’s t test).
Figure 7
Figure 7
Ultrastructural examination of hook complex and centrin arm by immuno-electron microscopy. (A) Flagella were isolated from control and cells depleted of TbSmee1 (TbSmee1 Removed) for 6 days, and then labeled with antibodies against TbMORN1 and a secondary antibody conjugated to 10 nm gold beads. Black arrowhead denotes the probasal body, while white arrowhead denotes the mature basal body. Asterisk demarcates the elongation of the centrin arm. (B) Isolated flagella from control and TbSmee1-depleted cells (TbSmee1 Removed) on day 6. Boxes highlight density of TbMORN1 10 nm gold particles on HC shank (dashed box) and centrin arm (solid box).
Figure 8
Figure 8
Loss of TbSmee1 leads to HC-centrin arms with varying sizes and redistribution of TbMORN1 labeling. (A) Representative output of MATLAB GUI created to segment HC-centrin arms into 200 nm regions and count TbMORN1 immunogold within each region. (B) Quantitation of HC-centrin arm segments from control and TbSmee1 removed isolated flagella on day 6. Data is mean ± SEM of three independent experiments. (C) Quantitation of the percentage of TbMORN1 immunogold particles in each segment position and the frequency of the presence of the segment position on day 6 in control and TbSmee1-removed cells. Data is mean ± SD of three independent experiments. (D) Heat map of the percentage of TbMORN1 immunogold particles per segment in representative illustrations of median-length HC-centrin arms in control and TbSmee1-removed cells.
Figure 9
Figure 9
Restoring TbSmee1 in depleted cells leads to recovery of cell growth and hook complex morphology. (A) Growth of control and TbSmee1-depleted cells (TbSmee1 Removed) was monitored for 6 days by cell growth before the addition of doxycycline (arrow) to rescue the TbSmee1-depleted cells (TbSmee1 Rescue). Monitoring continued for an additional 6 days. Data are means ± SD of three independent experiments. (B) Quantification of hook complex morphologies on day 9 in non-dividing 1N1K control, TbSmee1-depleted (TbSmee1 Removed) and TbSmee1-rescued (TbSmee1 Rescue) cells. (C) Modeling of hook complex morphology restoration after 24 hours of doxycycline re-addition. (D) A dividing TbSmee1-rescued cell detergent extracted, fixed, and labeled with antibodies against TbCentrin4 (green) and antibodies against TbMORN1 (red). DAPI was used to label DNA (DNA; blue). DIC and fluorescence microscopy were used for imaging. Data are means ± SD of three independent experiments. n.s, not significant; *, P ≤ 0.05, ***, P≤ 0.001; ****, P ≤ 0.0001(One-way ANOVA).
Figure 10
Figure 10
Depletion of TbSmee1 results in delayed uptake of membrane and fluid-phase markers into the flagellar pocket. (A) Workflow of FM4-64FX uptake protocol. (B) Live cell DIC and fluorescence microscopy of representative control cells treated with FM4-64FX (FM4-64FX; red) at either 4 °C or 27 °C and Hoechst to label DNA (DNA; blue). Closed arrowhead indicates FP region. (C) Quantitation of 1N1K control and TbSmee1-removed cells with FM4-64FX labeling in the flagellar pocket. Data are means ± SD of three independent experiments. *, P ≤ 0.05 (Student’s t test). (D) Workflow of 488-Dextran uptake protocol. (E) Live cell DIC and fluorescence microscopy of representative control cells treated with fluorescent dextran (Dextran; green) at either 4°C or 27°C and Hoechst to label DNA (DNA; blue). Closed arrowhead indicates FP region. (F) Quantitation of 1N1K control and TbSmee1-removed cells with fluorescent dextran in FP region. Data are means ± SD of three independent experiments. *, P ≤ 0.05 (multiple two-tailed unpaired Student’s t test).

Similar articles

Cited by

References

    1. Absalon S, Blisnick T, Bonhivers M, Kohl L, Cayet N, Toutirais G, et al. Flagellum elongation is required for correct structure, orientation and function of the flagellar pocket in Trypanosoma brucei. Journal of Cell Science. 2008;121:3704–3716. - PubMed
    1. Acosta-Serrano A, Vassella E, Liniger M, Kunz Renggli C, Brun R, Roditi I, Englund PT. The surface coat of procyclic Trypanosoma brucei: programmed expression and proteolytic cleavage of procyclin in the tsetse fly. Proceedings of the National Academy of Sciences. 2001;98:1513–1518. - PMC - PubMed
    1. Alexander DL, Schwartz KJ, Balber AE, Bangs JD. Developmentally regulated trafficking of the lysosomal membrane protein p67 in Trypanosoma brucei. J Cell Sci. 2002;115:3253–3263. - PubMed
    1. Allen CL, Goulding D, Field MC. Clathrin-mediated endocytosis is essential in Trypanosoma brucei. EMBO J. 2003;22:4991–5002. - PMC - PubMed
    1. André J, Harrison S, Towers K, Qi X, Vaughan S, McKean PG, Ginger ML. The tubulin cofactor C family member TBCCD1 orchestrates cytoskeletal filament formation. Journal of Cell Science. 2013;126:5350–5356. - PubMed

Publication types

MeSH terms

LinkOut - more resources