. 2018 Feb;17(1):e12701.
doi: 10.1111/acel.12701. Epub 2017 Nov 26.

FOXO protects against age-progressive axonal degeneration

Affiliations

FOXO protects against age-progressive axonal degeneration

Inah Hwang et al. Aging Cell. 2018 Feb.

Abstract

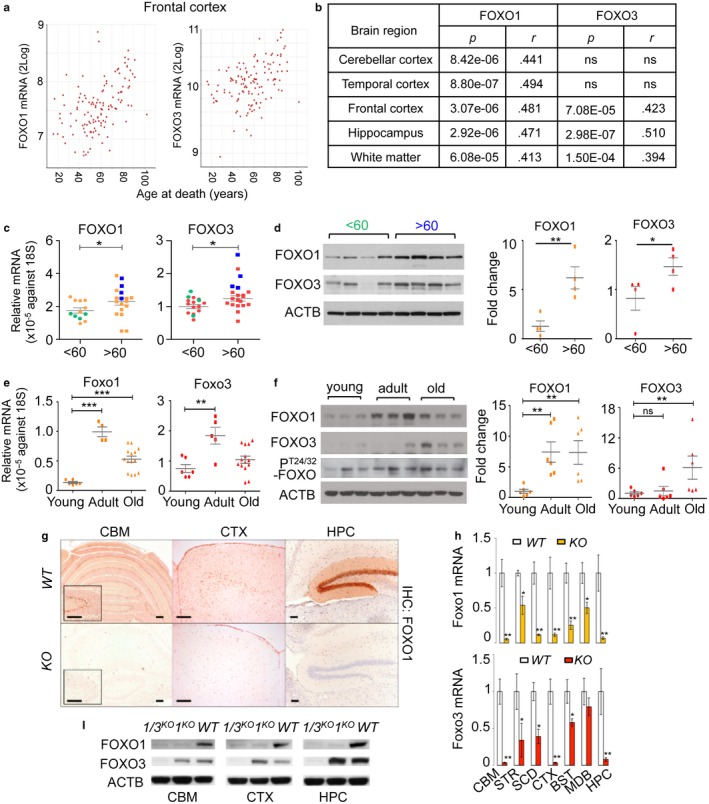
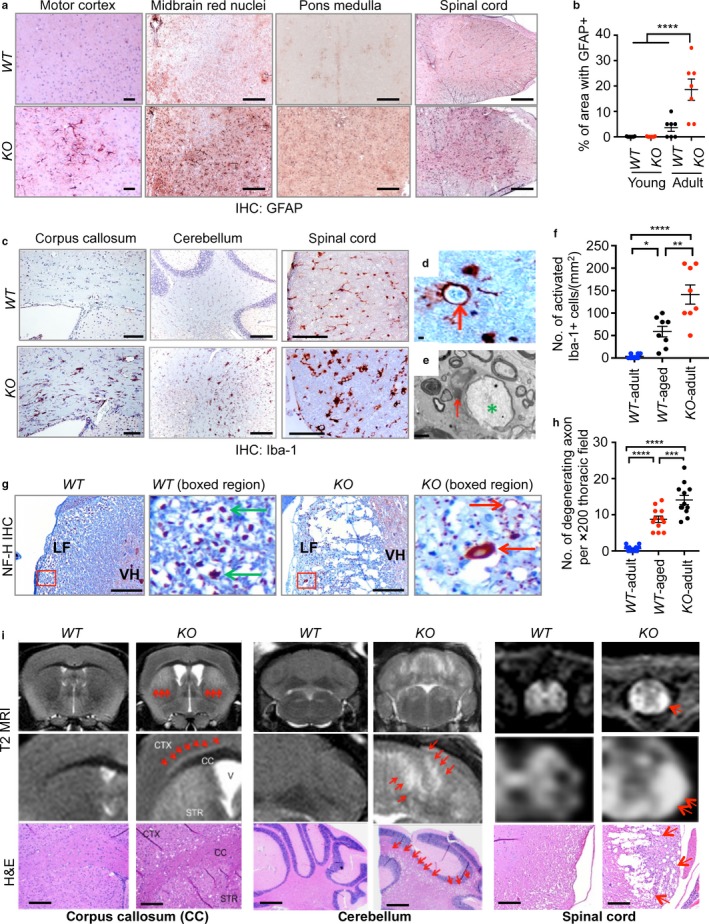
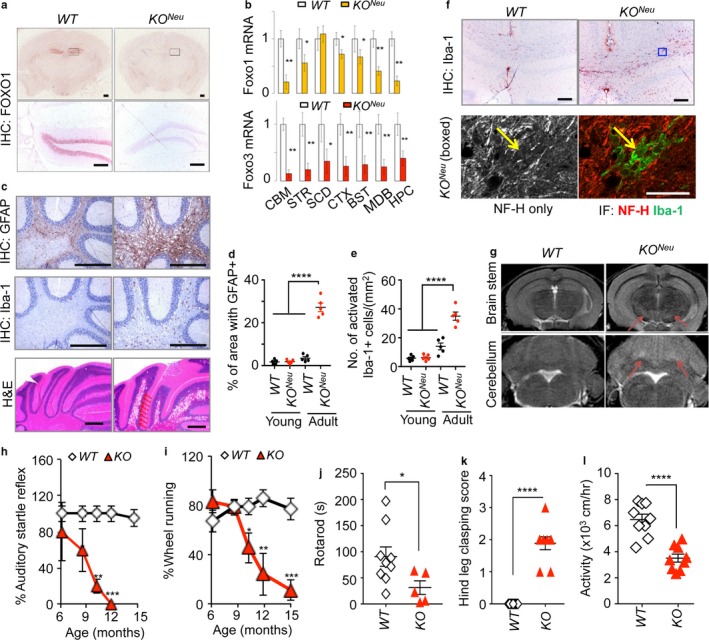
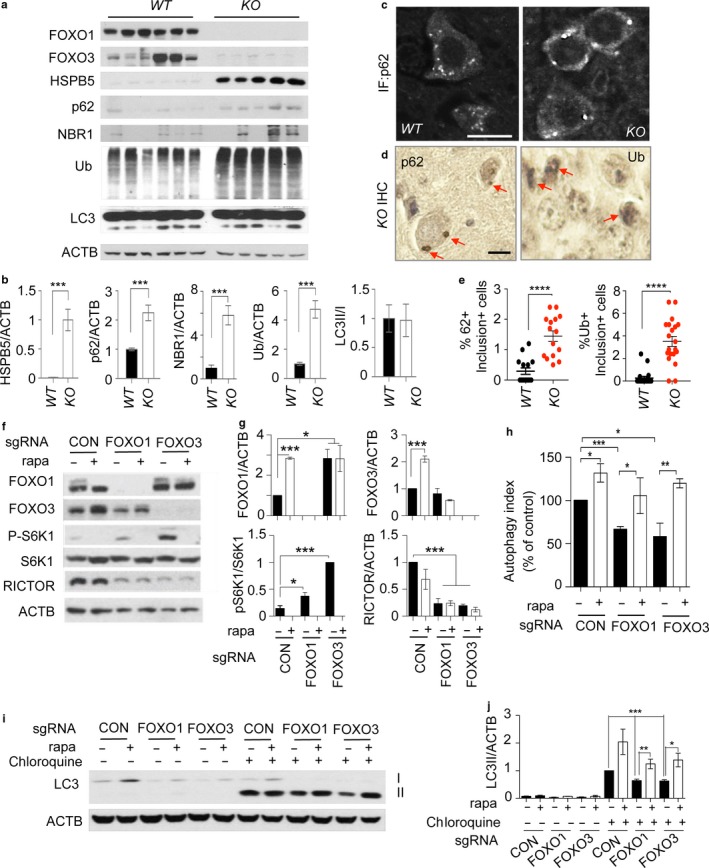
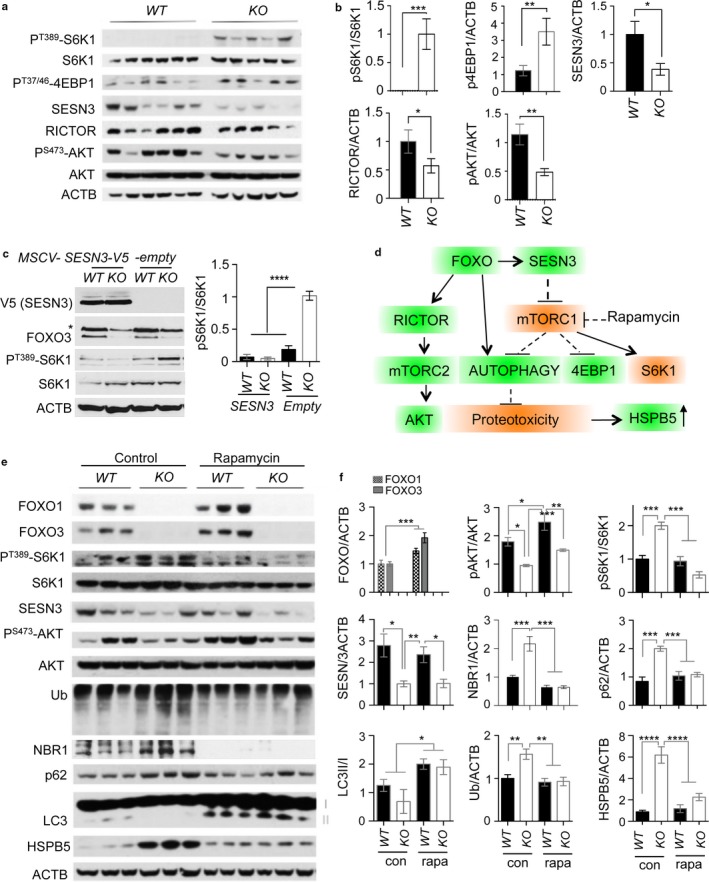
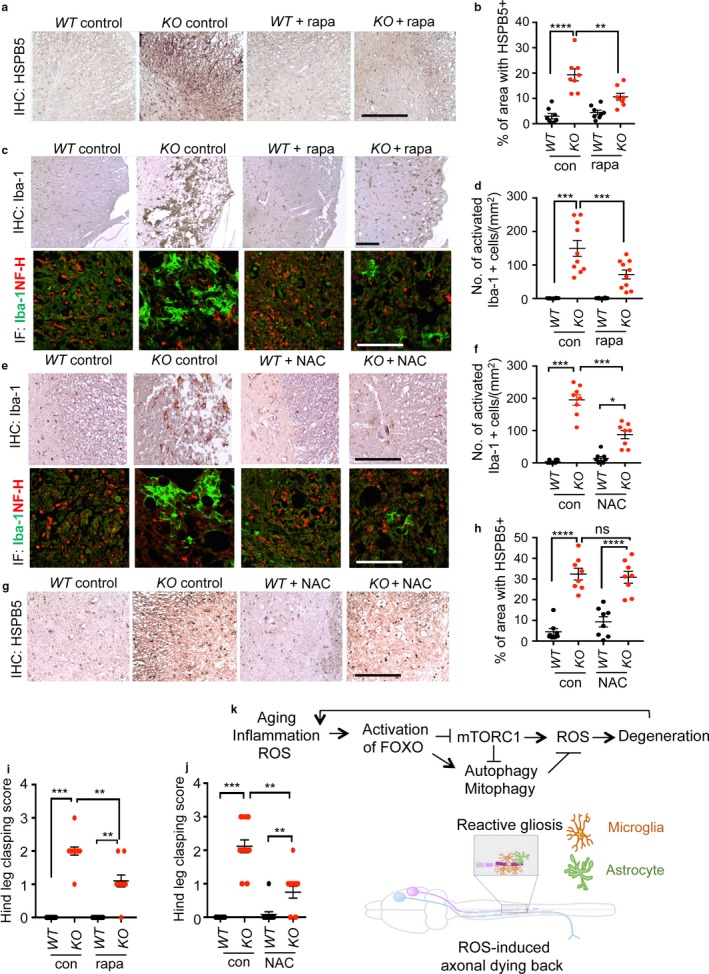
Neurodegeneration resulting in cognitive and motor impairment is an inevitable consequence of aging. Little is known about the genetic regulation of this process despite its overriding importance in normal aging. Here, we identify the Forkhead Box O (FOXO) transcription factor 1, 3, and 4 isoforms as a guardian of neuronal integrity by inhibiting age-progressive axonal degeneration in mammals. FOXO expression progressively increased in aging human and mouse brains. The nervous system-specific deletion of Foxo transcription factors in mice accelerates aging-related axonal tract degeneration, which is followed by motor dysfunction. This accelerated neurodegeneration is accompanied by levels of white matter astrogliosis and microgliosis in middle-aged Foxo knockout mice that are typically only observed in very old wild-type mice and other aged mammals, including humans. Mechanistically, axonal degeneration in nerve-specific Foxo knockout mice is associated with elevated mTORC1 activity and accompanying proteotoxic stress due to decreased Sestrin3 expression. Inhibition of mTORC1 by rapamycin treatment mimics FOXO action and prevented axonal degeneration in Foxo knockout mice with accelerated nervous system aging. Defining this central role for FOXO in neuroprotection during mammalian aging offers an invaluable window into the aging process itself.

Keywords: FOXO; accelerated aging; aging; central nervous system; mouse models; neurodegeneration; neuroinflammation; oxidative stress.


Figures

Figure 1
Figure 1
Expression of FOXO increases in aging brain. (a) XY plots of FOXO1 or FOXO3 mRNA expression within the noted brain regions vs. age of the subjects at time of death. (b) Pearson correlation coefficients (r) and p‐values for the correlation of FOXO1 or FOXO3 mRNA expression in various regions of the human brain with the age. (c) The mRNA expressions of FOXO1 and FOXO3 were measured in human cerebellums (n = 33). Blue and green dots indicate samples used for WB in (d). The mRNA (e) and protein (f) expression of Foxo1, Foxo3, and phospho‐T24/32 Foxo1/3 in young (<3‐month, n = 6), adult (3‐18‐month, n = 6), and old (18–20‐month, n = 6) FVB/B6 mixed‐strain mouse cerebellums is shown. Each dot represents individual animal. Error bars, mean ± SEM. *p < .05; **p < .01; ***p < .005. Statistical significance was determined by unpaired t‐test. (g) FOXO1 IHC analysis of brain sections of WT and Foxo 1/3/4 KO mice. Residual FOXO1 immunoreactivity in KO mice is visible in endothelial cells (inset). Scale bar = 200 μm. (h) RTqPCR results for Foxo1 and Foxo3 mRNA. Empty bars represent WT, and colored bars represent KO tissues (n = 4). (i) Representative Western blotting results. Foxo1‐ or Foxo1/3‐specific knockouts (1 KO or 1/3 KO) selectively lost targeted isoforms. CBM—cerebellum, STR—striatum, SCD—spinal cord, CTX—cortex, BST—brain stem, MDB—midbrain, HPC—hippocampus
Figure 2
Figure 2
Acceleration of aging‐associated axonal tract degeneration in Foxo 1/3/4 knockout mice. Axonal tract degeneration and associated reactive gliosis in brains and spinal cords are shown from adult mice as determined by GFAP (a), Iba‐1 (c, d), or Neurofilament H (NF‐H) (g) IHC (n = 6–8). Quantitation of multiple IHC results is plotted (b, f, h). Error bars, mean ± SEM. *p < .05; **p < .01; ***p < .005; ****p < .001. Statistical significance was determined by one‐way ANOVA. (d) Activated phagocytic microglia (red arrow) wraps around cellular debris from adult KO spinal cord. (e) Electron microscopy identified microglia (red arrow)‐wrapped axonal remnants (green *). (g) Typical large axons (green arrow) and dystrophic swollen and degenerating axons (red arrow) are shown from boxed areas. LF, lateral funiculus; VH, ventral horn. (i) A close correspondence between cavitations in H&E sections and T2 MRI hyperintensity (red arrows). Scale bars = 200 μm (a, c, g, i) and 2 μm (d, e)
Figure 3
Figure 3
A neuron‐specific deletion of Foxo 1/3/4 causes axonal degeneration. (a) FOXO1 IHC analysis of brains from mice with the indicated genotypes. Corresponding boxed regions indicate the dentate gyrus and are shown in the lower panels. (b) RTqPCR analysis of Foxo1 and Foxo3 mRNA (n = 4). Colored bars represent KON eu tissues. (c) Indicated IHC analysis and H&E staining of cerebellums from adult (15 mo) KON eu animals are shown. Arrows point to cavitations caused by degeneration. Scale bar = 200 μm. Quantitation of multiple IHC results is shown for GFAP (d) or Iba‐1 (e). Error bars, mean ± SEM. ****p < .001. One‐way ANOVA. (f) Iba‐1 IHC analysis of the hippocampal commissure from adult animals. Blue outline boxed region was further analyzed by co‐IF of NF‐H and Iba‐1 in lower panels. Yellow arrow points to degenerating axon remnant overlapping with microglia. Scale bars = 200 (IHC) and 20 (IF) μm. (g) T2‐MRI of brains in adult mice with the indicated genotypes. Arrows point to hyperintensity lesions. (h) Auditory startle reflexes and (i) the voluntary wheel‐running activity. WT (n = 7), KO (n = 5). (j) Rotarod motor coordination test, (k) hind leg clasping score, and (l) locomotor activity of 12‐month‐old WT (n = 9) and KO (n = 5–9). Error bars, mean ± SEM. *p < .05; **p < .01; ***p < .005. Statistical significance was determined by unpaired t‐test
Figure 4
Figure 4
Increased proteotoxic stress and defective autophagy in Foxo1/3/4 knockout mice. (a) Tissue lysates from 12‐month‐old WT and KO brain cortex were analyzed by WB of indicated proteins. (c) p62 IF and (d) p62 and Ub IHC on cortical neurons from 12‐month‐old WT and KO brain cortex. Red arrows point to labeling positive inclusions. Scale bar = 200 μm. (e) Quantitation of representative results for (d). (f) Indicated genotype of neural progenitor cultures was differentiated into neurons for 5 days. Some cultures were treated with rapamycin (100 ng/ml) for 24 hr on day 4 of differentiation. (h) The autophagy activity was analyzed by flow cytometry. The bar graph shows autophagy indices as % of control of (f). (i) Cultures as in (f) were treated with chloroquine (100 ng/ml) for 4 hr and analyzed for the expression levels of LC3 by WB. Representative result from three to five independent experiments is shown. (b, g, j) Quantitation of WB band densities. Only chloroquine‐treated cultures were statistically compared in (j). Error bars, mean ± SEM. *p < .05. **p < .01, ***p < .005; ****p < .001. Statistical significance was determined by one‐way ANOVA
Figure 5
Figure 5
Inhibition of aberrant mTORC1 activation suppresses proteotoxic stress in Foxo 1/3/4 knockout mice. (a) Tissue lysates from 12‐month‐old WT and KO brain cortex were analyzed by WB of indicated proteins. (c) Representative WB of primary neuronal cultures from WT and KO animals infected with indicated retroviral particles. (d) A summary of FOXO and mTORC1 crosstalk leading to the counterbalancing or proteotoxicity. (e) Tissue lysates from 12‐month‐old either rapamycin‐treated or not, WT and KO brain cortex were analyzed by WB of indicated proteins. (b, c, f) Quantitation of WB band intensities. *p < .05; **p < .01; ***p < .005; ****p < .001. Statistical significance was determined by one‐way ANOVA
Figure 6
Figure 6
Restoring autophagy and reducing ROS prevent axonal degeneration. HSPB5 (a, g) or Iba‐1 (c, e, upper panels) IHC and NF‐H/Iba‐1 co‐IF (c, e, lower panels) analysis of transverse sections of the thoracic spinal cord (n = 8–10). Representative lesions in the lateral funiculi from animals treated for 24 weeks from 6 months of age are shown. (b, d, f, h) quantitation of IHC results. Scale bars = 200 μm. Hind leg clasping score of 12‐month‐old WT and KO mice with or without rapamycin (n = 10–12) (i) or NAC (n = 12–17) (j) treatment. Error bars, mean ± SEM. *p < .05; **p < .01; ***p < .005; ****p < .001. Statistical significance was determined by one‐way ANOVA. (k) A schematic summary

References

    1. Bodles, A. M. , & Barger, S. W. (2004). Cytokines and the aging brain ‐ what we don't know might help us. Trends in Neurosciences, 27, 621–626. https://doi.org/10.1016/j.tins.2004.07.011 - DOI - PubMed
    1. Bronson, R. T. , Lipman, R. D. , & Harrison, D. E. (1993). Age‐related gliosis in the white matter of mice. Brain Research, 609, 124–128. https://doi.org/10.1016/0006-8993(93)90864-J - DOI - PubMed
    1. Caccamo, A. , Majumder, S. , Richardson, A. , Strong, R. , & Oddo, S. (2010). Molecular interplay between mammalian target of rapamycin (mTOR), amyloid‐beta, and Tau: Effects on cognitive impairments. Journal of Biological Chemistry, 285, 13107–13120. https://doi.org/10.1074/jbc.M110.100420 - DOI - PMC - PubMed
    1. Calixto, A. , Jara, J. S. , & Court, F. A. (2012). Diapause formation and downregulation of insulin‐like signaling via DAF‐16/FOXO delays axonal degeneration and neuronal loss. PLoS Genetics, 8, e1003141 https://doi.org/10.1371/journal.pgen.1003141 - DOI - PMC - PubMed
    1. Chen, C. C. , Jeon, S. M. , Bhaskar, P. T. , Nogueira, V. , Sundararajan, D. , Tonic, I. , … Hay, N. (2010). FoxOs inhibit mTORC1 and activate Akt by inducing the expression of Sestrin3 and Rictor. Developmental Cell, 18, 592–604. https://doi.org/10.1016/j.devcel.2010.03.008 - DOI - PMC - PubMed

Publication types

MeSH terms

Substances