

Micro-Nanostructures of Cellulose-Collagen for Critical Sized Bone Defect Healing
- PMID: 29178402
- PMCID: PMC5835266
- DOI: 10.1002/mabi.201700263
Micro-Nanostructures of Cellulose-Collagen for Critical Sized Bone Defect Healing
Abstract
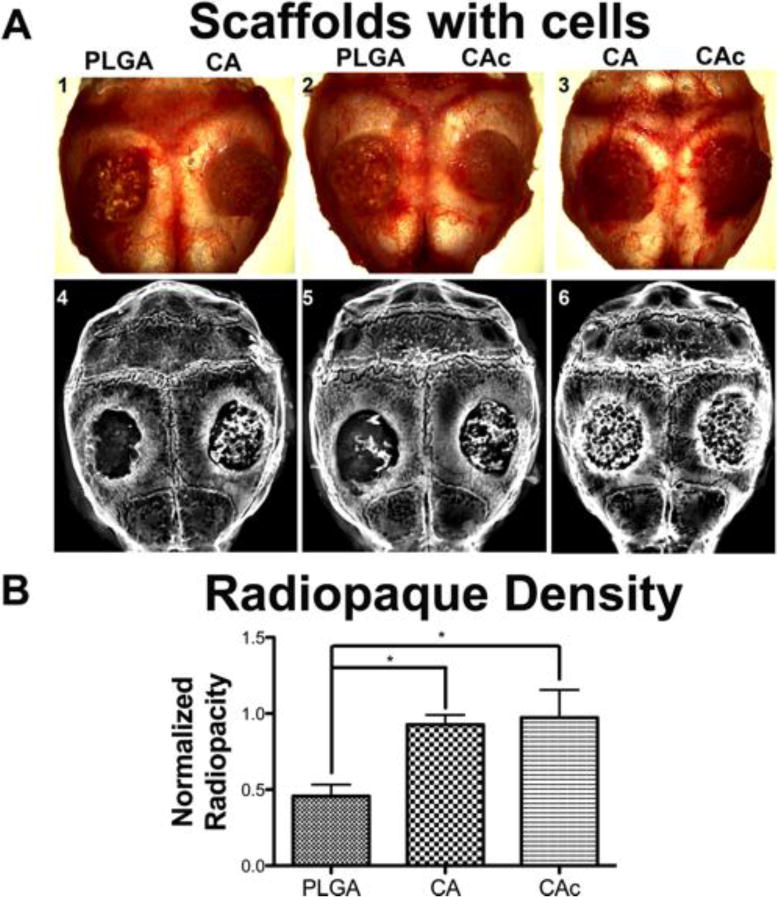
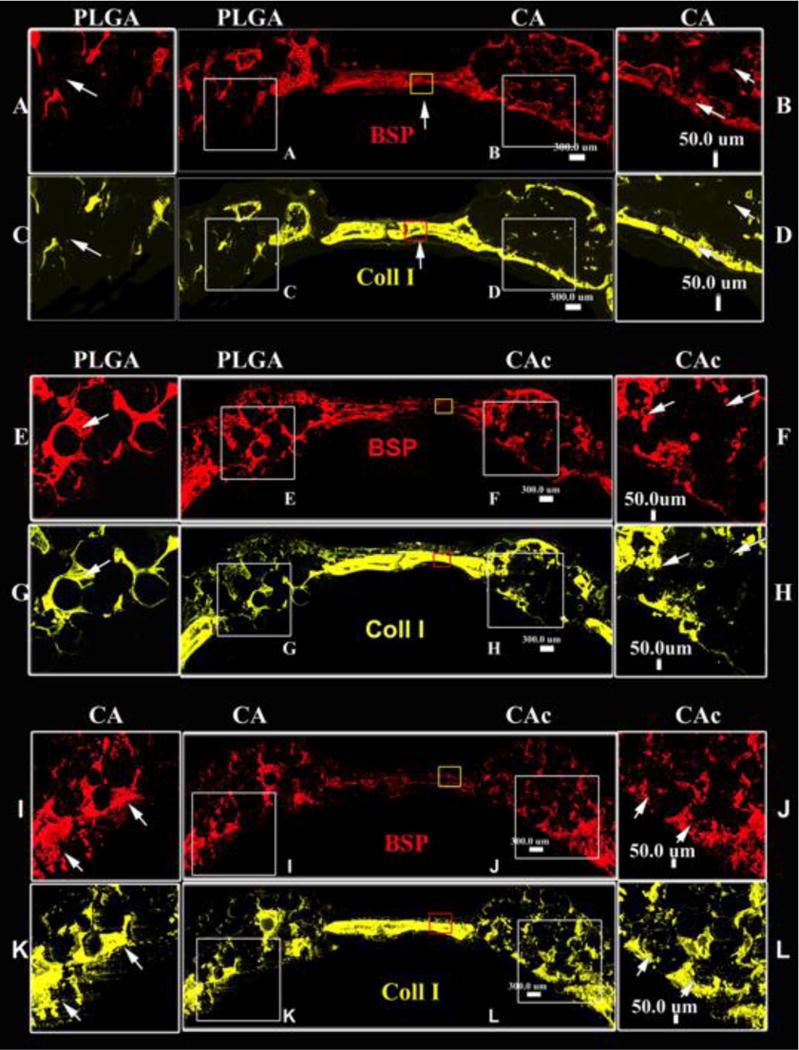
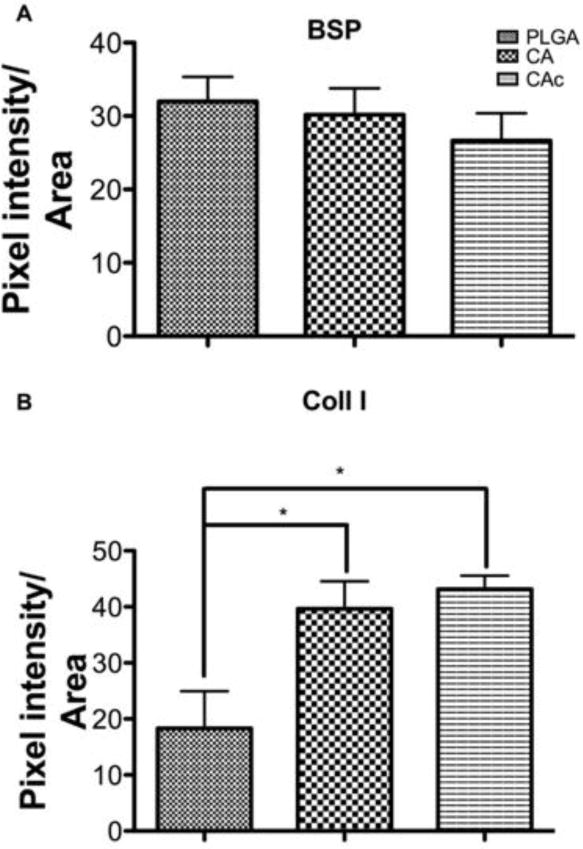
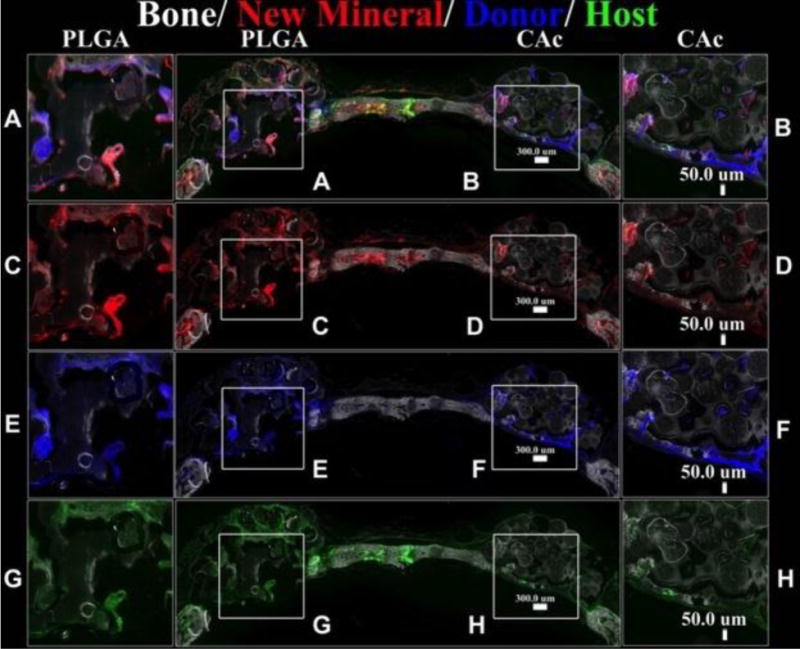
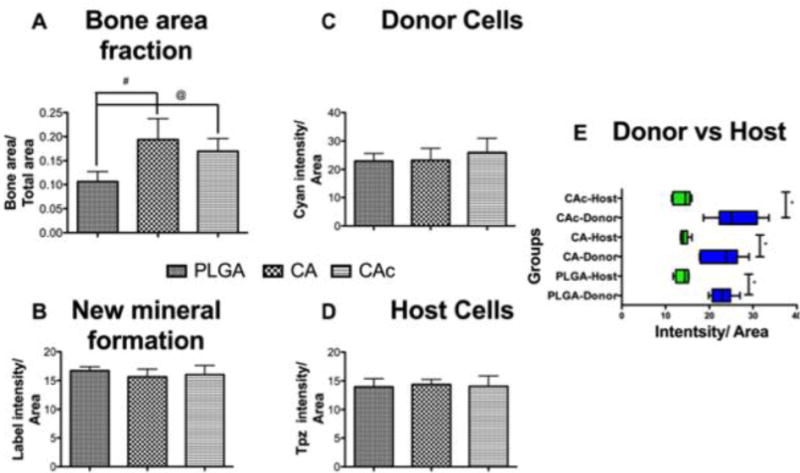
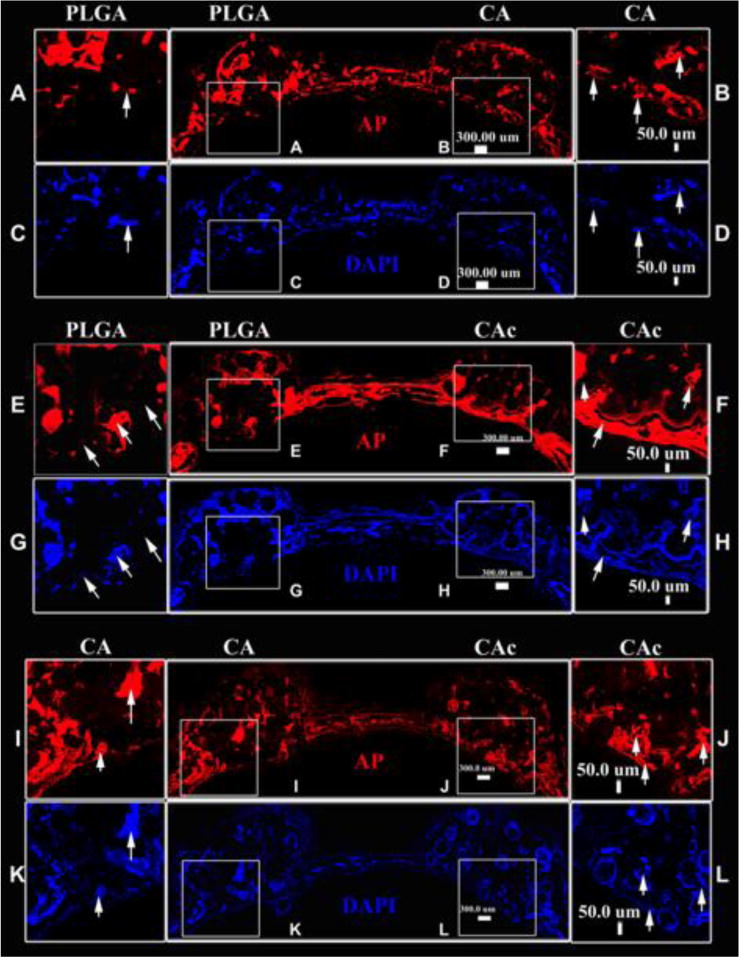
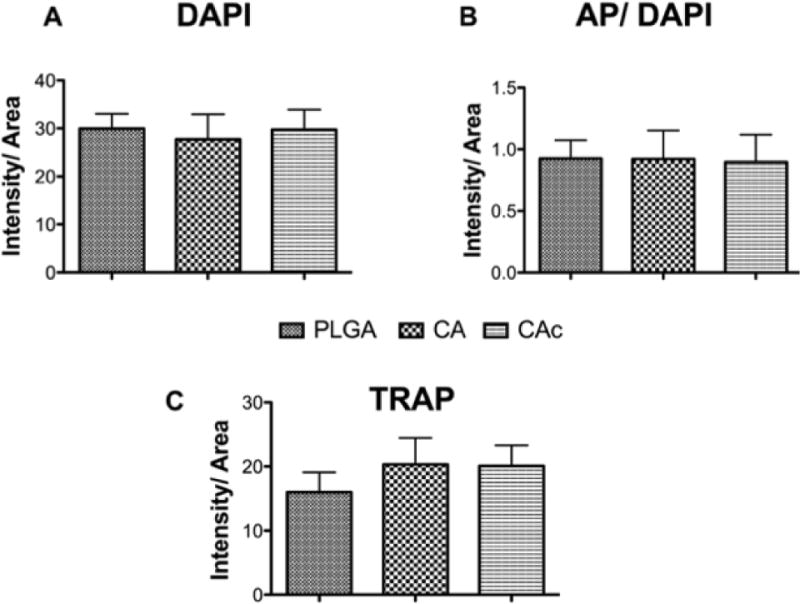
Bone tissue engineering strategies utilize biodegradable polymeric matrices alone or in combination with cells and factors to provide mechanical support to bone, while promoting cell proliferation, differentiation, and tissue ingrowth. The performance of mechanically competent, micro-nanostructured polymeric matrices, in combination with bone marrow stromal cells (BMSCs), is evaluated in a critical sized bone defect. Cellulose acetate (CA) is used to fabricate a porous microstructured matrix. Type I collagen is then allowed to self-assemble on these microstructures to create a natural polymer-based, micro-nanostructured matrix (CAc). Poly (lactic-co-glycolic acid) matrices with identical microstructures serve as controls. Significantly higher number of implanted host cells are distributed in the natural polymer based micro-nanostructures with greater bone density and more uniform cell distribution. Additionally, a twofold increase in collagen content is observed with natural polymer based scaffolds. This study establishes the benefits of natural polymer derived micro-nanostructures in combination with donor derived BMSCs to repair and regenerate critical sized bone defects. Natural polymer based materials with mechanically competent micro-nanostructures may serve as an alternative material platform for bone regeneration.
Keywords: bone; micro-nanostructures; regeneration; stem cells; tissue engineering.
© 2017 WILEY-VCH Verlag GmbH & Co. KGaA, Weinheim.
Figures
Similar articles
-
Micro-Nanostructured Polymeric Scaffolds for Bone Tissue Engineering.Int J High Speed Electron Syst. 2024 Jun-Sep;33(2-3):2440075. doi: 10.1142/s0129156424400755. Int J High Speed Electron Syst. 2024. PMID: 40196706 Free PMC article.
-
Natural Polymer-Based Micronanostructured Scaffolds for Bone Tissue Engineering.Methods Mol Biol. 2022;2394:669-691. doi: 10.1007/978-1-0716-1811-0_35. Methods Mol Biol. 2022. PMID: 35094352
-
Biomimetic mineralization of novel hydroxyethyl cellulose/soy protein isolate scaffolds promote bone regeneration in vitro and in vivo.Int J Biol Macromol. 2020 Nov 1;162:1627-1641. doi: 10.1016/j.ijbiomac.2020.08.029. Epub 2020 Aug 8. Int J Biol Macromol. 2020. PMID: 32781127
-
Osteoinductive biomaterial geometries for bone regenerative engineering.Curr Pharm Des. 2013;19(19):3446-55. doi: 10.2174/1381612811319190010. Curr Pharm Des. 2013. PMID: 23432675 Review.
-
Recent trends in the application of widely used natural and synthetic polymer nanocomposites in bone tissue regeneration.Mater Sci Eng C Mater Biol Appl. 2020 May;110:110698. doi: 10.1016/j.msec.2020.110698. Epub 2020 Jan 29. Mater Sci Eng C Mater Biol Appl. 2020. PMID: 32204012 Free PMC article. Review.
Cited by
-
Insulin-Functionalized Bioactive Fiber Matrices with Bone Marrow-Derived Stem Cells in Rat Achilles Tendon Regeneration.ACS Appl Bio Mater. 2022 Jun 20;5(6):2851-2861. doi: 10.1021/acsabm.2c00243. Epub 2022 Jun 1. ACS Appl Bio Mater. 2022. PMID: 35642544 Free PMC article.
-
Cellulose-based composite scaffolds for bone tissue engineering and localized drug delivery.Bioact Mater. 2022 May 26;20:137-163. doi: 10.1016/j.bioactmat.2022.05.018. eCollection 2023 Feb. Bioact Mater. 2022. PMID: 35663339 Free PMC article. Review.
-
Injectable RANKL sustained release formulations to accelerate orthodontic tooth movement.Eur J Orthod. 2020 Jun 23;42(3):317-325. doi: 10.1093/ejo/cjz027. Eur J Orthod. 2020. PMID: 31147678 Free PMC article.
-
A Review on Micro- to Nanocellulose Biopolymer Scaffold Forming for Tissue Engineering Applications.Polymers (Basel). 2020 Sep 8;12(9):2043. doi: 10.3390/polym12092043. Polymers (Basel). 2020. PMID: 32911705 Free PMC article. Review.
-
Insulin immobilized PCL-cellulose acetate micro-nanostructured fibrous scaffolds for tendon tissue engineering.Polym Adv Technol. 2019 May;30(5):1205-1215. doi: 10.1002/pat.4553. Epub 2019 Feb 4. Polym Adv Technol. 2019. PMID: 30956516 Free PMC article.
References
-
- Campana V, Milano G, Pagano E, Barba M, Cicione C, Salonna G, Lattanzi W, Logroscino G. Journal of Materials Science: Materials in Medicine. 2014;25:2445. - PMC - PubMed
- Greenwald AS, Boden SD, Goldberg VM, Khan Y, Laurencin CT, Rosier RN. The Journal of Bone & Joint Surgery. 2001;83:S98. - PubMed
- Finkemeier CG. J Bone Joint Surg Am. 2002;84:454. - PubMed
- Faour O, Dimitriou R, Cousins CA, Giannoudis PV. Injury. 2011;42:S87. - PubMed
-
- Bacakova L, Filova E, Parizek M, Ruml T, Svorcik V. Biotechnology advances. 2011;29:739. - PubMed
-
- Lampin M, Warocquier-Clérout R, Legris C, Degrange M, Sigot-Luizard M. Journal of biomedical materials research. 1997;36:99. - PubMed
Publication types
MeSH terms
Substances
Grants and funding
LinkOut - more resources
Full Text Sources
Other Literature Sources
