

Association of variation in the sugarcane transcriptome with sugar content
- PMID: 29178834
- PMCID: PMC5702190
- DOI: 10.1186/s12864-017-4302-5
Association of variation in the sugarcane transcriptome with sugar content
Abstract
Background: Sugarcane is a major crop of the tropics cultivated mainly for its high sucrose content. The crop is genetically less explored due to its complex polyploid genome. Sucrose synthesis and accumulation are complex processes influenced by physiological, biochemical and genetic factors, and the growth environment. The recent focus on the crop for fibre and biofuel has led to a renewed interest on understanding the molecular basis of sucrose and biomass traits. This transcriptome study aimed to identify genes that are associated with and differentially regulated during sucrose synthesis and accumulation in the mature stage of sugarcane. Patterns of gene expression in high and low sugar genotypes as well as mature and immature culm tissues were studied using RNA-Seq of culm transcriptomes.
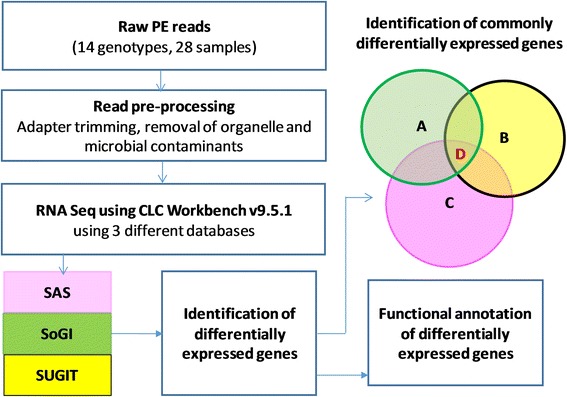
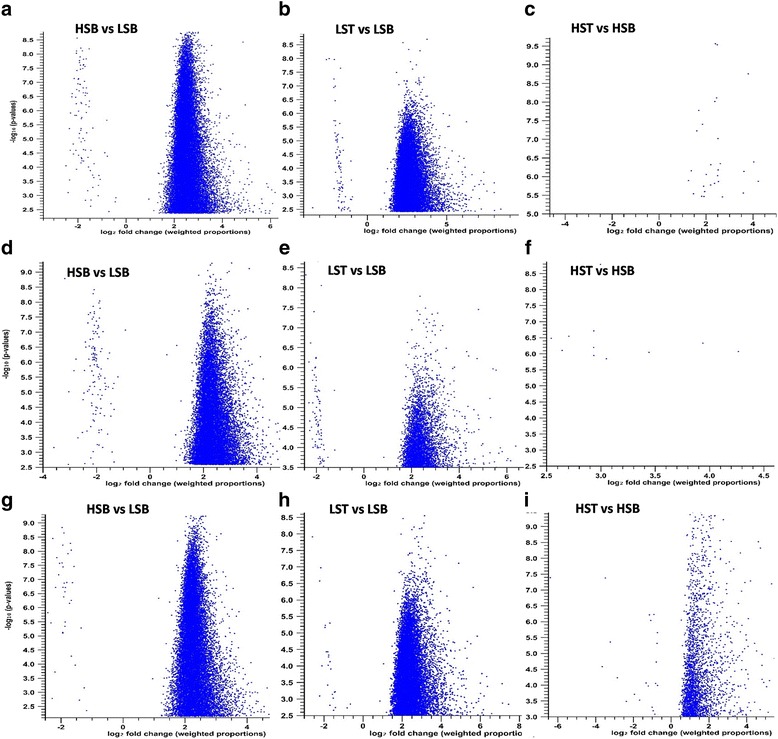
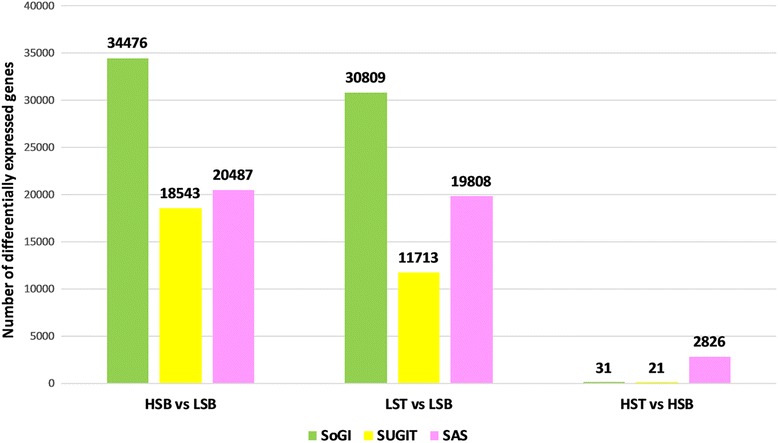
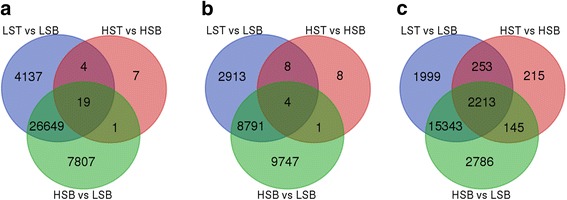
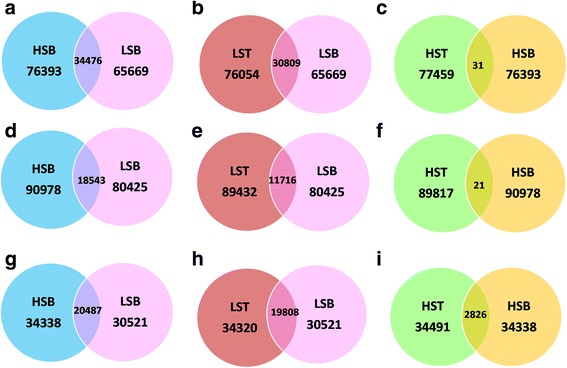
Results: In this study, 28 RNA-Seq libraries from 14 genotypes of sugarcane differing in their sucrose content were used for studying the transcriptional basis of sucrose accumulation. Differential gene expression studies were performed using SoGI (Saccharum officinarum Gene Index, 3.0), SAS (sugarcane assembled sequences) of sugarcane EST database (SUCEST) and SUGIT, a sugarcane Iso-Seq transcriptome database. In total, about 34,476 genes were found to be differentially expressed between high and low sugar genotypes with the SoGI database, 20,487 genes with the SAS database and 18,543 genes with the SUGIT database at FDR < 0.01, using the Baggerley's test. Further, differential gene expression analyses were conducted between immature (top) and mature (bottom) tissues of the culm. The DEGs were functionally annotated using GO classification and the genes consistently associated with sucrose accumulation were identified.
Conclusions: The large number of DEGs may be due to the large number of genes that influence sucrose content or are regulated by sucrose content. These results indicate that apart from being a primary metabolite and storage and transport sugar, sucrose may serve as a signalling molecule that regulates many aspects of growth and development in sugarcane. Further studies are needed to confirm if sucrose regulates the expression of the identified DEGs or vice versa. The DEGs identified in this study may lead to identification of genes/pathways regulating sucrose accumulation and/or regulated by sucrose levels in sugarcane. We propose identifying the master regulators of sucrose if any in the future.
Keywords: High and low sugar genotypes; Sucrose; Sucrose genes; Sugarcane transcriptome; Transcriptome.
Conflict of interest statement
Ethics approval and consent to participate
Sugarcane genotypes were collected from the field planting at Sugar Research Australia’s Brandon station, Queensland, Australia. No ethics approval was required for the conduct of experiments in this study.
Consent for publication
Not applicable.
Competing interests
The authors declare that they have no competing interests.
Publisher’s Note
Springer Nature remains neutral with regard to jurisdictional claims in published maps and institutional affiliations.
Figures
Similar articles
-
Analysis of the diversity and tissue specificity of sucrose synthase genes in the long read transcriptome of sugarcane.BMC Plant Biol. 2019 Apr 25;19(1):160. doi: 10.1186/s12870-019-1733-y. BMC Plant Biol. 2019. PMID: 31023213 Free PMC article.
-
Culm transcriptome sequencing of Badila (Saccharum officinarum L.) and analysis of major genes involved in sucrose accumulation.Plant Physiol Biochem. 2019 Nov;144:455-465. doi: 10.1016/j.plaphy.2019.10.016. Epub 2019 Oct 19. Plant Physiol Biochem. 2019. PMID: 31655344
-
Ethylene-mediated improvement in sucrose accumulation in ripening sugarcane involves increased sink strength.BMC Plant Biol. 2019 Jun 28;19(1):285. doi: 10.1186/s12870-019-1882-z. BMC Plant Biol. 2019. PMID: 31253103 Free PMC article.
-
Sugarcane for bioenergy production: an assessment of yield and regulation of sucrose content.Plant Biotechnol J. 2010 Apr;8(3):263-76. doi: 10.1111/j.1467-7652.2009.00491.x. Plant Biotechnol J. 2010. PMID: 20388126 Review.
-
Transcriptome analysis of starch and sucrose metabolism across bulb development in Sagittaria sagittifolia.Gene. 2018 Apr 5;649:99-112. doi: 10.1016/j.gene.2018.01.075. Epub 2018 Jan 31. Gene. 2018. PMID: 29374598 Review.
Cited by
-
Genetic manipulation of trehalose-6-phosphate synthase results in changes in the soluble sugar profile in transgenic sugarcane stems.Plant Direct. 2021 Nov 7;5(11):e358. doi: 10.1002/pld3.358. eCollection 2021 Nov. Plant Direct. 2021. PMID: 34765864 Free PMC article.
-
Temporal Gene Expression in Apical Culms Shows Early Changes in Cell Wall Biosynthesis Genes in Sugarcane.Front Plant Sci. 2021 Dec 13;12:736797. doi: 10.3389/fpls.2021.736797. eCollection 2021. Front Plant Sci. 2021. PMID: 34966397 Free PMC article.
-
Integrated Metabolomics and Transcriptome Analyses Unveil Pathways Involved in Sugar Content and Rind Color of Two Sugarcane Varieties.Front Plant Sci. 2022 Jun 16;13:921536. doi: 10.3389/fpls.2022.921536. eCollection 2022. Front Plant Sci. 2022. PMID: 35783968 Free PMC article.
-
The Impact of cDNA Normalization on Long-Read Sequencing of a Complex Transcriptome.Front Genet. 2019 Jul 23;10:654. doi: 10.3389/fgene.2019.00654. eCollection 2019. Front Genet. 2019. PMID: 31396260 Free PMC article.
-
Identification of potential MTAs and candidate genes for juice quality- and yield-related traits in Saccharum clones: a genome-wide association and comparative genomic study.Mol Genet Genomics. 2022 May;297(3):635-654. doi: 10.1007/s00438-022-01870-w. Epub 2022 Mar 7. Mol Genet Genomics. 2022. PMID: 35257240
References
-
- Casu R, Dimmock C, Thomas M, Bower N, Knight D, Grof C, McIntyre L, Jackson P, Jordan D, Whan V. Proc Int soc sugar cane Technol: 2001. 2001. Genetic and expression profiling in sugarcane; pp. 542–546.
MeSH terms
Substances
LinkOut - more resources
Full Text Sources
Other Literature Sources
Research Materials
