. 2017 Nov 25;11(1):113.
doi: 10.1186/s12918-017-0491-4.

A multiscale modeling study of particle size effects on the tissue penetration efficacy of drug-delivery nanoparticles

Affiliations

A multiscale modeling study of particle size effects on the tissue penetration efficacy of drug-delivery nanoparticles

Mohammad Aminul Islam et al. BMC Syst Biol. .

Abstract

Background: Particle size is a key parameter for drug-delivery nanoparticle design. It is believed that the size of a nanoparticle may have important effects on its ability to overcome the transport barriers in biological tissues. Nonetheless, such effects remain poorly understood. Using a multiscale model, this work investigates particle size effects on the tissue distribution and penetration efficacy of drug-delivery nanoparticles.

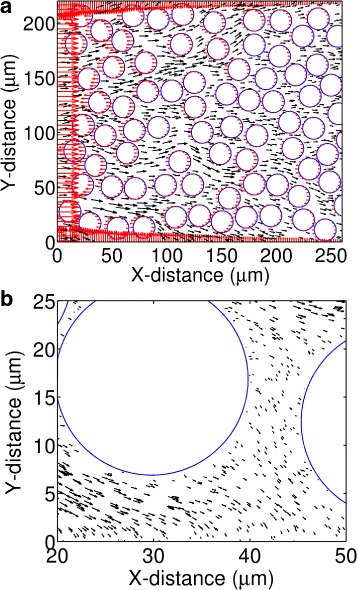
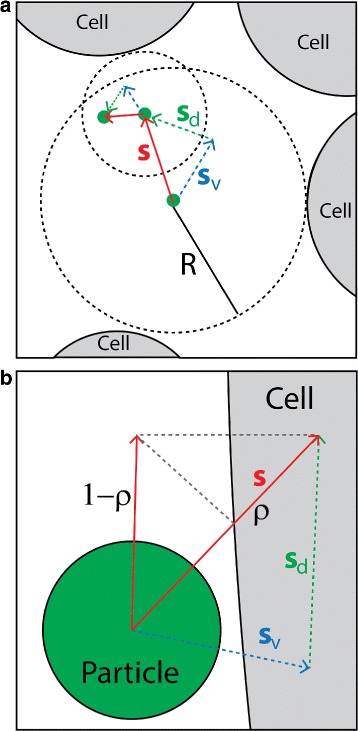
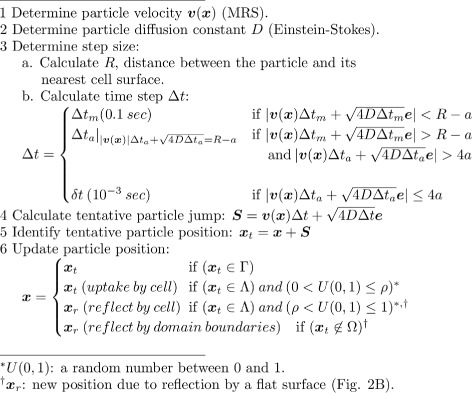
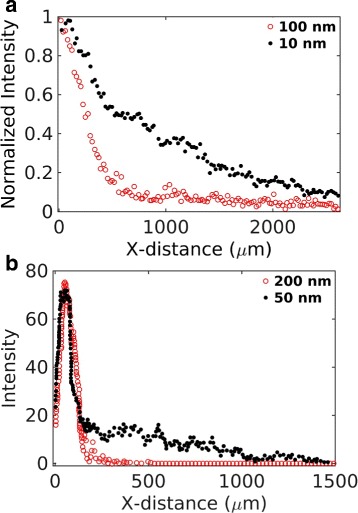
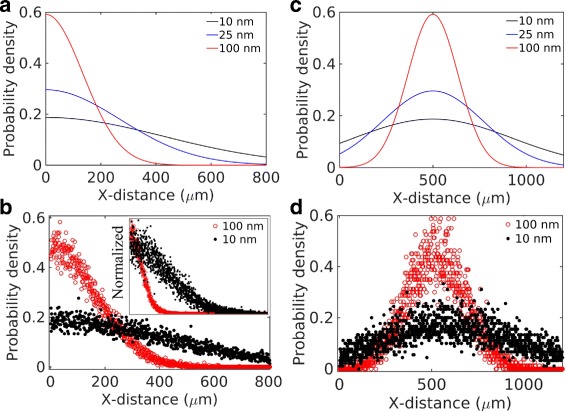
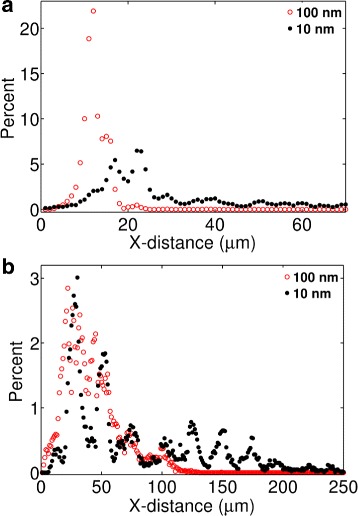
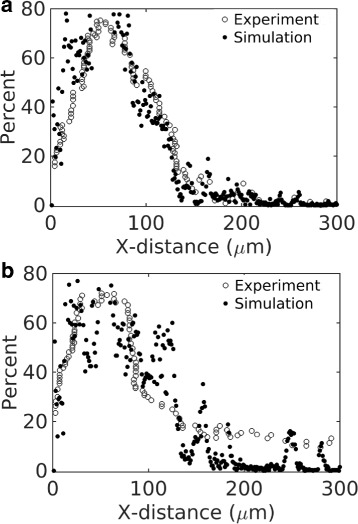
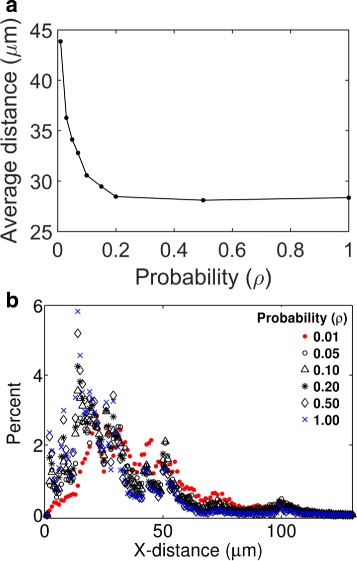
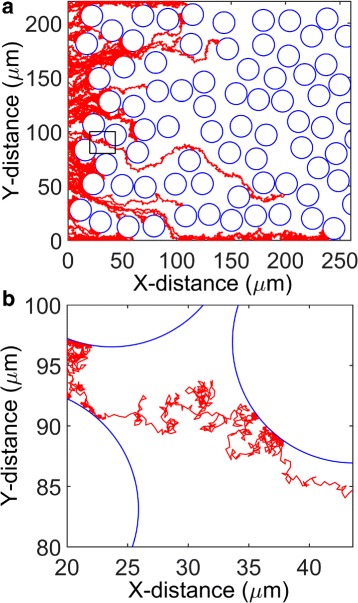
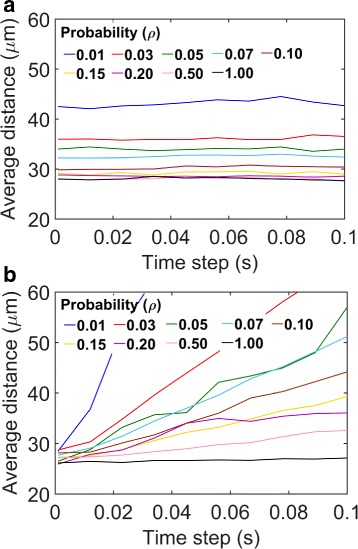
Results: We have developed a multiscale spatiotemporal model of nanoparticle transport in biological tissues. The model implements a time-adaptive Brownian Dynamics algorithm that links microscale particle-cell interactions and adhesion dynamics to tissue-scale particle dispersion and penetration. The model accounts for the advection, diffusion, and cellular uptakes of particles. Using the model, we have analyzed how particle size affects the intra-tissue dispersion and penetration of drug delivery nanoparticles. We focused on two published experimental works that investigated particle size effects in in vitro and in vivo tissue conditions. By analyzing experimental data reported in these two studies, we show that particle size effects may appear pronounced in an in vitro cell-free tissue system, such as collagen matrix. In an in vivo tissue system, the effects of particle size could be relatively modest. We provide a detailed analysis on how particle-cell interactions may determine distribution and penetration of nanoparticles in a biological tissue.

Conclusion: Our work suggests that the size of a nanoparticle may play a less significant role in its ability to overcome the intra-tissue transport barriers. We show that experiments involving cell-free tissue systems may yield misleading observations of particle size effects due to the absence of advective transport and particle-cell interactions.

Keywords: Brownian dynamics; Diffusion; Drug delivery; Porous media; Tumor.


Conflict of interest statement

Ethics approval and consent to participate

Not applicable.

Consent for publication

Not applicable.

Competing interests

The authors declare that they have no competing interests.

Publisher’s Note

Springer Nature remains neutral with regard to jurisdictional claims in published maps and institutional affiliations.

Figures

Fig. 1
Fig. 1
The MRS calculated force and velocity fields in a rectangular tissue section. a The red arrows represent force vectors at discrete locations along the domain edges and cell boundaries. The black arrows represent velocity vectors in the interstitial space. b A zoomed-in view of the velocity vectors in the interstitial space and near the cell boundaries
Fig. 2
Fig. 2
Illustration of the time-adaptive BD algorithm. a Particle motion in the bulk fluid. The small green circle represents a nanoparticle, and the large gray circles represent cells. The radius of the dashed circle, R, represents the distance between a particle’s current position and its nearest cell boundary. In the bulk fluid, particle jump S is taken adaptively so that |S|<Ra. |S| is determined by the time step Δ t: S=S v+S d, where S v=v Δ t (displacement due to advection), and Sd=4DΔte (displacement due to diffusion). b Particle motion near a cell boundary. |S| is determined by a constant but fine resolution time step δ t=10−3 seconds. The cell boundary represents a sticky wall that captures or reflects a colliding particle with probability ρ and 1−ρ, respectively
Fig. 3
Fig. 3
Pseudocode for the simulation algorithm
Fig. 4
Fig. 4
Experimental data adapted from two earlier works [6, 7]. a Data from Figure 3H of Wong et al. [6]. The figure compares distribution of 100 nm (red) and 10 nm (black) nanoparticles in collagen in an in vitro experiment. b Experimental data adapted from Fig. 5d of Tang et al. [7]. The figure compares tumor tissue distribution of 200 nm (red) and 50 nm (black) particles in an in vivo experiment
Fig. 5
Fig. 5
Particle size effects in a cell-free system. a Theoretical model (Eq. 6) and b simulation considering pure diffusion. c Theoretical model (Eq. 7) and d simulation considering a small advection (0.05 μm/s) and diffusion
Fig. 6
Fig. 6
Predicted particle size effects in the presence of cells. The panels represent the following conditions: a pure diffusion and cells; b advection, diffusion, and cells. All simulations were carried out considering ρ=0.01. The fluid velocity at the tissue entry (left edge) was assumed v=1 μm/s [9]
Fig. 7
Fig. 7
Comparison between simulation and experiement. The open circles represent the experimental data of Fig. 4 b (plotted in a different scale). The filled circles represent simulation. a Particle size is 200 nm. b Particle size is 50 nm
Fig. 8
Fig. 8
Predicted effects of cellular uptake rates on tissue distribution of nanoparticles. a Mean depth of tissue penetration by particles as a function of ρ. The mean depth of penetration represents the average of the horizontal positions (X-coordinate) of 16,000 simulated particles in 104 seconds after their tissue entry. b Histograms showing distribution of the nanoparticles. Each histogram corresponds to a different value of ρ, as indicated in the figure legend
Fig. 9
Fig. 9
Representative travel paths of simulated nanoparticles. a Travel paths of 100 nanoparticles in the tissue domain. The particles are of identical size (100 nm radius). b A zoomed-in view showing a single particle travel path and its interaction with a cell boundary. Panel B corresponds to the small region in Panel A marked by a rectangle
Fig. 10
Fig. 10
Effect of time step Δ t m variation on model predictions. a Average tissue penetration by particles as a function of Δ t m. Each curve corresponds to a different value of ρ (the probability of particle capture by a cell in a collision between the particle and the cell.) b The analysis of Panel A is repeated using a non-adaptive BD algorithm based on Rejniak et al. [9]

References

    1. Alonso MJ. Nanomedicines for overcoming biological barriers. Biomed Pharmacother. 2004;58(3):168–72. doi: 10.1016/j.biopha.2004.01.007. - DOI - PubMed
    1. Jain RK, Stylianopoulos T. Delivering nanomedicine to solid tumors. Nat Rev Clin Oncol. 2010;7(11):653–64. doi: 10.1038/nrclinonc.2010.139. - DOI - PMC - PubMed
    1. Blanco E, Shen H, Ferrari M. Principles of nanoparticle design for overcoming biological barriers to drug delivery. Nat Biotechnol. 2015;33(9):941–51. doi: 10.1038/nbt.3330. - DOI - PMC - PubMed
    1. Barua S, Mitragotri S. Challenges associated with penetration of nanoparticles across cell and tissue barriers: a review of current status and future prospects. Nano Today. 2014;9(2):223–43. doi: 10.1016/j.nantod.2014.04.008. - DOI - PMC - PubMed
    1. Gaumet M, Vargas A, Gurny R, Delie F. Nanoparticles for drug delivery: the need for precision in reporting particle size parameters. Eur J Pharm Biopharm. 2008;69(1):1–9. doi: 10.1016/j.ejpb.2007.08.001. - DOI - PubMed

LinkOut - more resources