

Elevated cyclic AMP levels promote BRAFCA/Pten-/- mouse melanoma growth but pCREB is negatively correlated with human melanoma progression
- PMID: 29179997
- PMCID: PMC5743623
- DOI: 10.1016/j.canlet.2017.11.027
Elevated cyclic AMP levels promote BRAFCA/Pten-/- mouse melanoma growth but pCREB is negatively correlated with human melanoma progression
Abstract
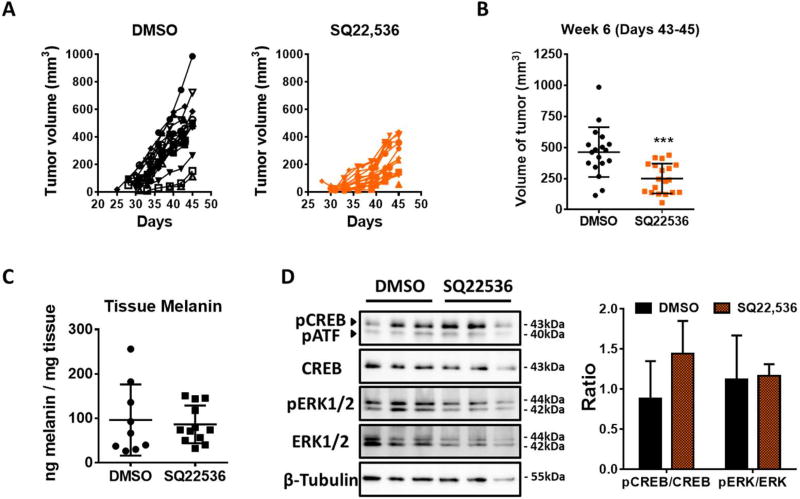
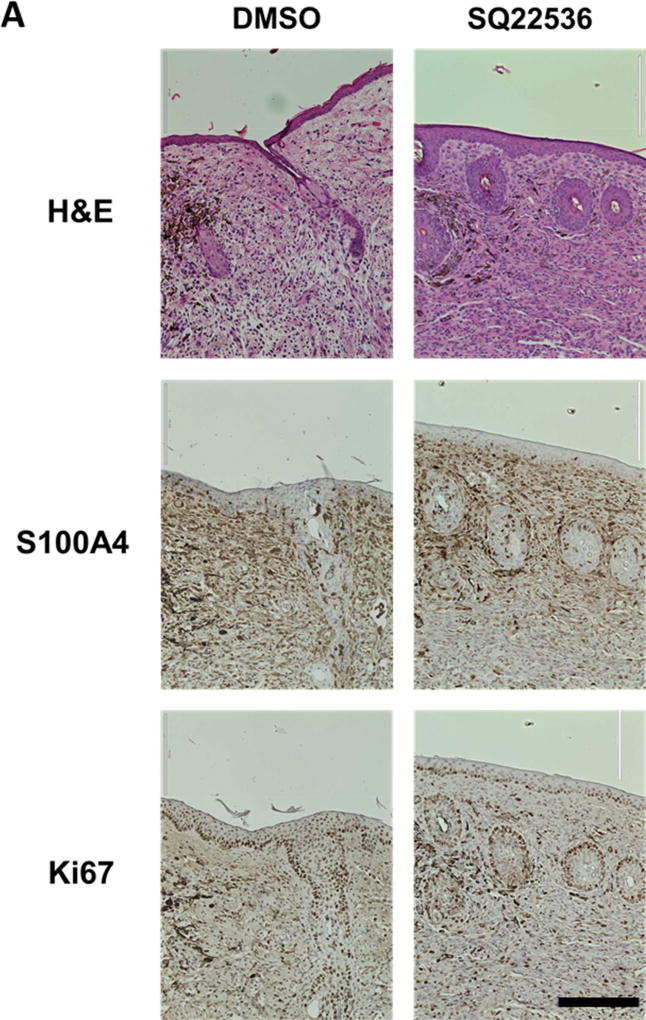
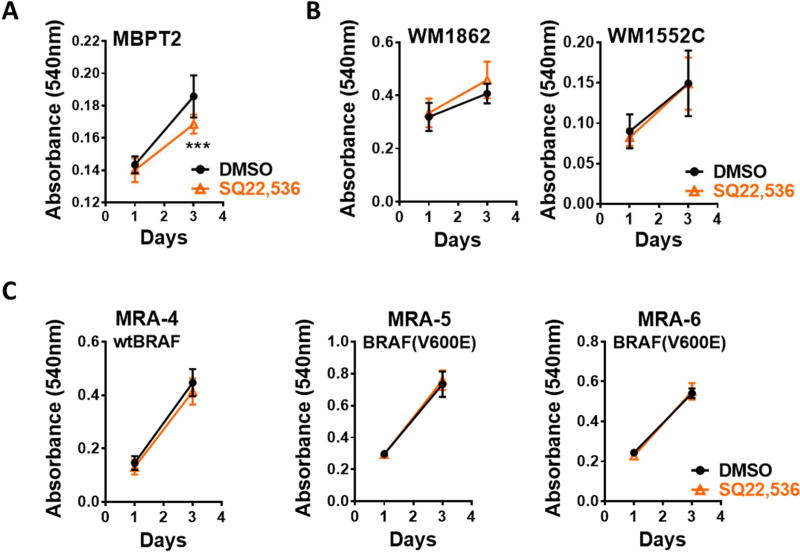
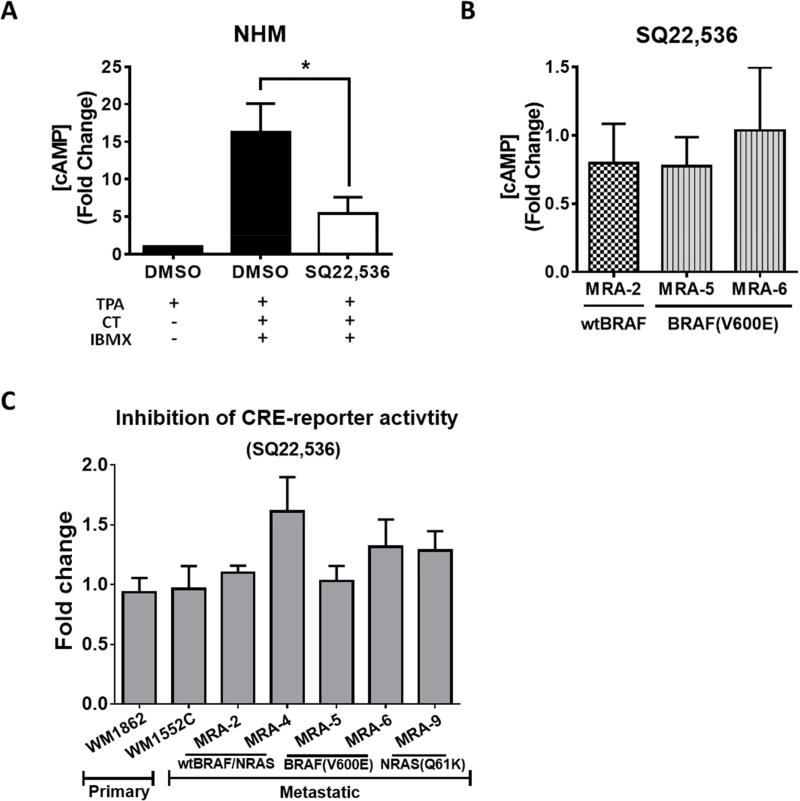
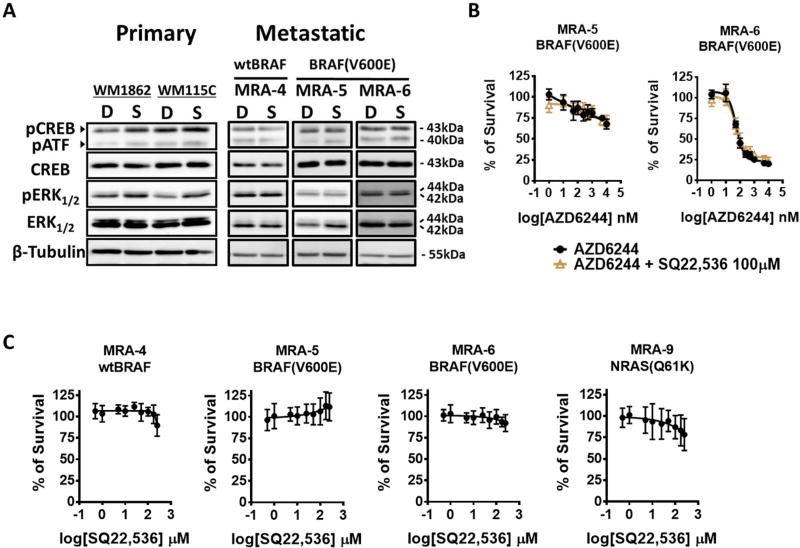
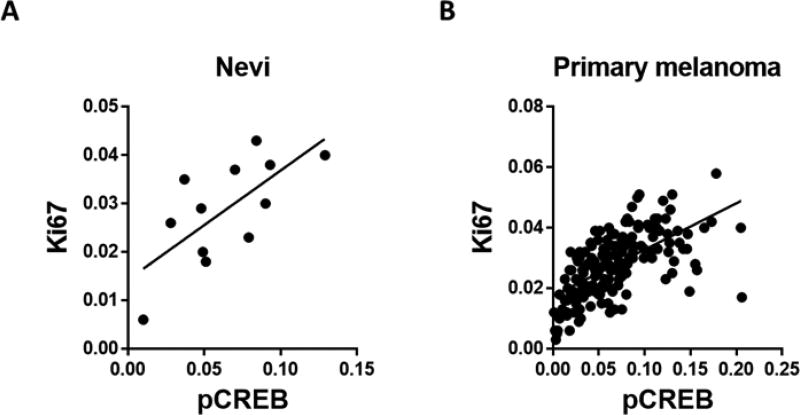
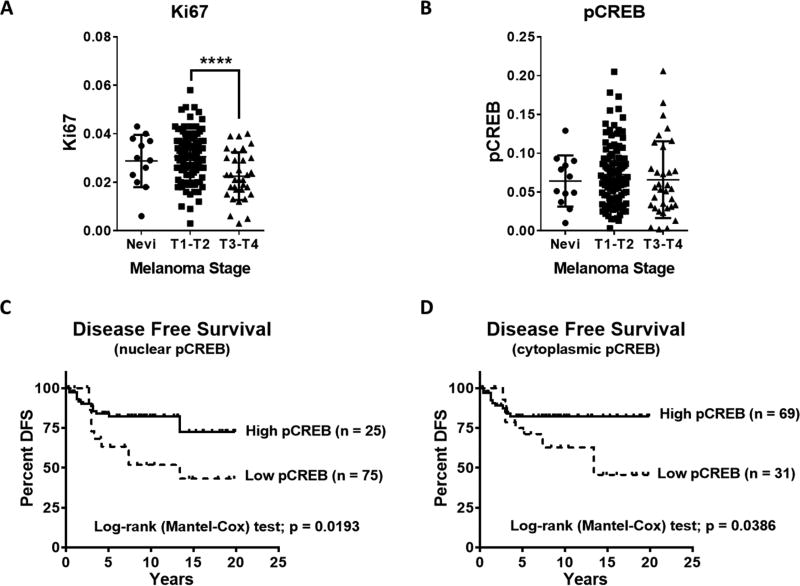
Melanocyte development and differentiation are regulated by cAMP, which is produced by the adenylate cyclase (AC) enzyme upon activation of the melanocortin-1-receptor (MC1R). Individuals carrying single amino acid substitution variants of MC1R have impaired cAMP signaling and higher risk of melanoma. However, the contribution of AC to this risk is not clear. Downstream of AC, the phosphorylated transcription factor, cyclic AMP Responsive Element Binding Protein (pCREB), which is activated by protein kinase A, regulates the expression of several genes including the melanocyte master regulator MITF. The roles of AC and CREB in melanoma development and growth are not well understood. Here, we investigated the effect of topical application of AC inhibitor on BrafCA/Pten-/- mouse melanoma development. We show that AC inhibitor delays melanoma growth independent of MAPK pathway activity and melanin content. Next, employing a primary melanoma tissue microarray and quantitative immunohistochemistry, we show that pCREB levels are positively correlated with the proliferative status of melanoma, but low pCREB expression is associated with tumor aggressiveness and metastatic recurrence. These data suggest that low cAMP signaling inhibits tumor growth but is a predictor of melanoma aggressiveness.
Keywords: Adenylate cyclase (AC); BRAF/PTEN melanoma; CREB; Cyclic AMP (cAMP); Melanoma progression; Melanoma tissue microarray.
Copyright © 2017 Elsevier B.V. All rights reserved.
Conflict of interest statement
The authors have no conflicts of interests to declare.
Figures
Similar articles
-
EPAC-RAP1 Axis-Mediated Switch in the Response of Primary and Metastatic Melanoma to Cyclic AMP.Mol Cancer Res. 2017 Dec;15(12):1792-1802. doi: 10.1158/1541-7786.MCR-17-0067. Epub 2017 Aug 29. Mol Cancer Res. 2017. PMID: 28851815 Free PMC article.
-
Cyclic AMP (cAMP) signaling in melanocytes and melanoma.Arch Biochem Biophys. 2014 Dec 1;563:22-7. doi: 10.1016/j.abb.2014.07.003. Epub 2014 Jul 10. Arch Biochem Biophys. 2014. PMID: 25017568 Review.
-
Functional status and relationships of melanocortin 1 receptor signaling to the cAMP and extracellular signal-regulated protein kinases 1 and 2 pathways in human melanoma cells.Int J Biochem Cell Biol. 2012 Dec;44(12):2244-52. doi: 10.1016/j.biocel.2012.09.008. Epub 2012 Sep 19. Int J Biochem Cell Biol. 2012. PMID: 23000456
-
cAMP-independent non-pigmentary actions of variant melanocortin 1 receptor: AKT-mediated activation of protective responses to oxidative DNA damage.Oncogene. 2018 Jul;37(27):3631-3646. doi: 10.1038/s41388-018-0216-1. Epub 2018 Apr 6. Oncogene. 2018. PMID: 29622793
-
Epigenetic regulation in human melanoma: past and future.Epigenetics. 2015;10(2):103-21. doi: 10.1080/15592294.2014.1003746. Epigenetics. 2015. PMID: 25587943 Free PMC article. Review.
Cited by
-
PLK1 and NOTCH Positively Correlate in Melanoma and Their Combined Inhibition Results in Synergistic Modulations of Key Melanoma Pathways.Mol Cancer Ther. 2021 Jan;20(1):161-172. doi: 10.1158/1535-7163.MCT-20-0654. Epub 2020 Nov 11. Mol Cancer Ther. 2021. PMID: 33177155 Free PMC article.
-
Targeting GPCRs and Their Signaling as a Therapeutic Option in Melanoma.Cancers (Basel). 2022 Jan 29;14(3):706. doi: 10.3390/cancers14030706. Cancers (Basel). 2022. PMID: 35158973 Free PMC article. Review.
-
Targeting Adenylate Cyclase Family: New Concept of Targeted Cancer Therapy.Front Oncol. 2022 Jun 27;12:829212. doi: 10.3389/fonc.2022.829212. eCollection 2022. Front Oncol. 2022. PMID: 35832555 Free PMC article. Review.
-
Cyclic AMP-regulatory element-binding protein: a novel UV-targeted transcription factor in skin cancer.Photochem Photobiol Sci. 2024 Jun;23(6):1209-1215. doi: 10.1007/s43630-024-00578-7. Epub 2024 May 14. Photochem Photobiol Sci. 2024. PMID: 38743195 Review.
-
GPR176 Promotes Cancer Progression by Interacting with G Protein GNAS to Restrain Cell Mitophagy in Colorectal Cancer.Adv Sci (Weinh). 2023 Apr;10(12):e2205627. doi: 10.1002/advs.202205627. Epub 2023 Mar 11. Adv Sci (Weinh). 2023. PMID: 36905238 Free PMC article.
References
-
- Pierre S, Eschenhagen T, Geisslinger G, Scholich K. Capturing adenylyl cyclases as potential drug targets. Nat Rev Drug Discov. 2009;8:321–335. - PubMed
-
- Rodríguez CI, Setaluri V. Cyclic AMP (cAMP) signaling in melanocytes and melanoma. Arch Biochem Biophys. 2014 - PubMed
-
- Box NF, Duffy DL, Irving RE, Russell A, Chen W, Griffyths LR, Parsons PG, Green AC, Sturm RA. Melanocortin-1 receptor genotype is a risk factor for basal and squamous cell carcinoma. J Invest Dermatol. 2001;116:224–229. - PubMed
-
- Box NF, Wyeth JR, O'Gorman LE, Martin NG, Sturm RA. Characterization of melanocyte stimulating hormone receptor variant alleles in twins with red hair. Hum Mol Genet. 1997;6:1891–1897. - PubMed
Publication types
MeSH terms
Substances
Grants and funding
LinkOut - more resources
Full Text Sources
Other Literature Sources
Medical
Molecular Biology Databases
Research Materials
