. 2018 Feb;29(2):557-570.
doi: 10.1681/ASN.2016121362. Epub 2017 Nov 27.

Redirecting TGF- β Signaling through the β-Catenin/Foxo Complex Prevents Kidney Fibrosis

Affiliations

Redirecting TGF- β Signaling through the β-Catenin/Foxo Complex Prevents Kidney Fibrosis

Xi Qiao et al. J Am Soc Nephrol. 2018 Feb.

Abstract

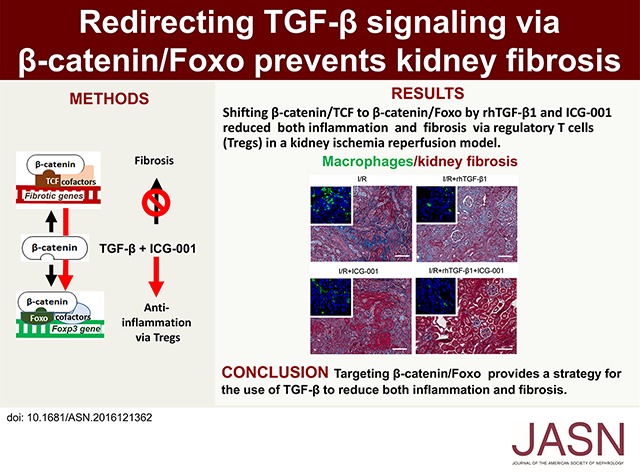
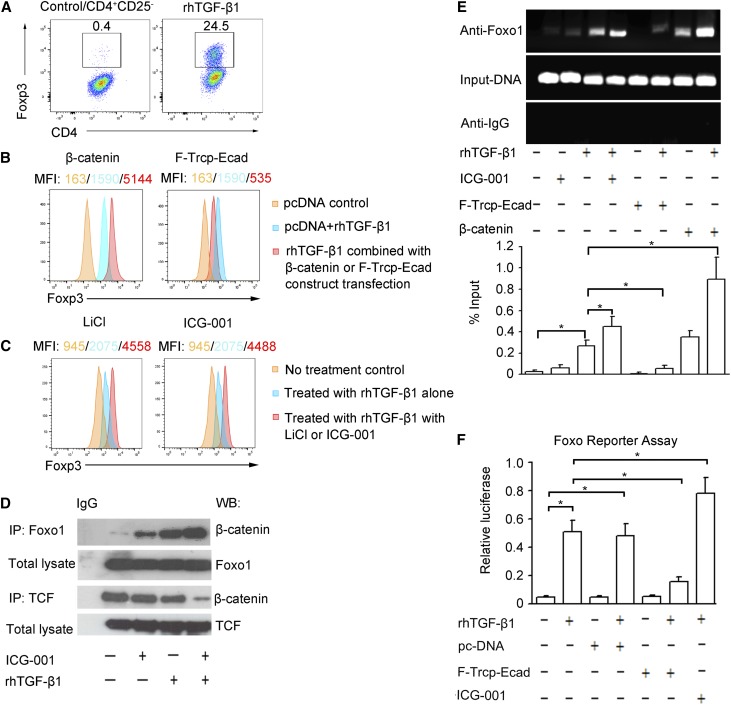
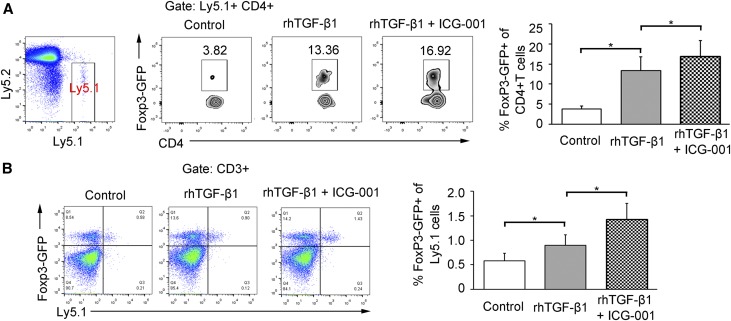
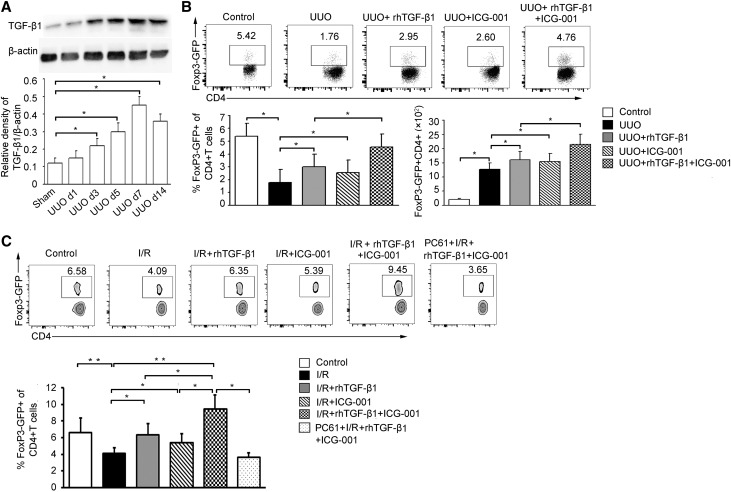
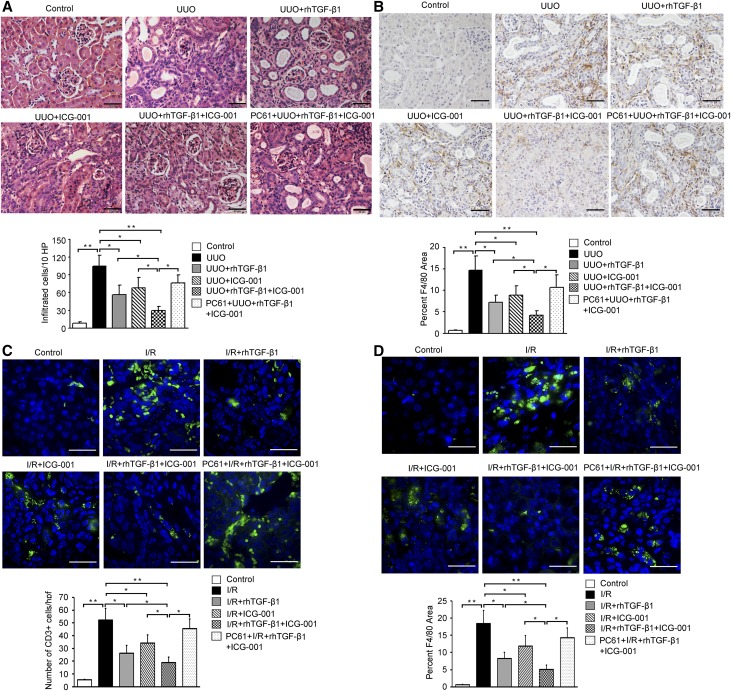
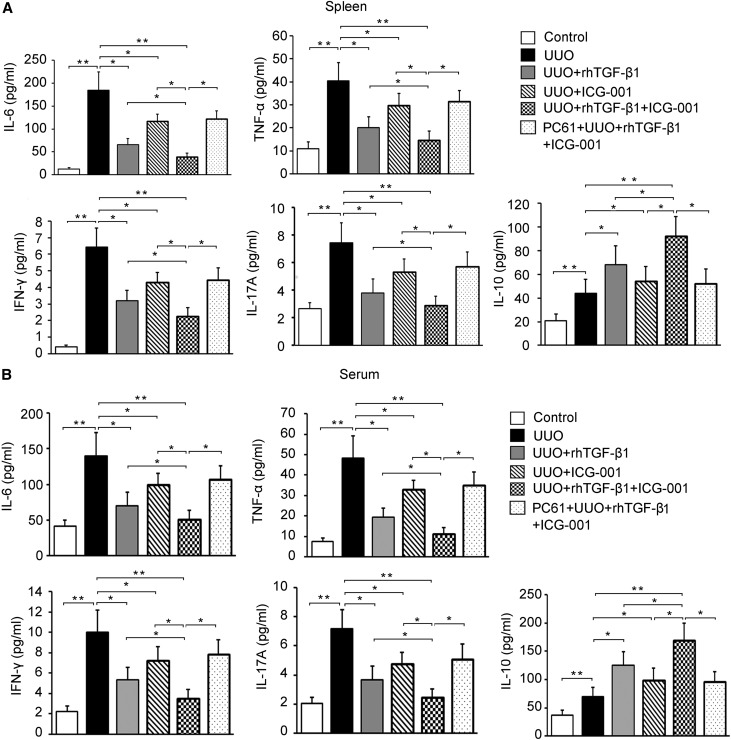
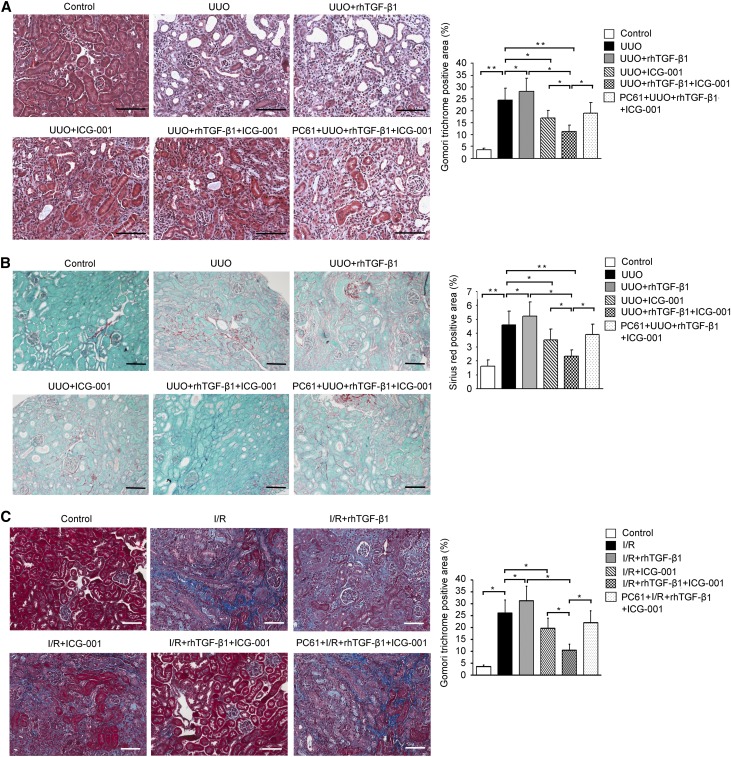
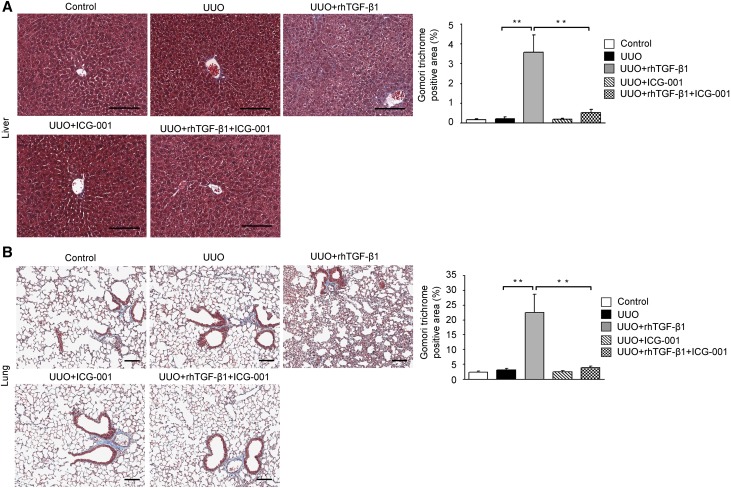
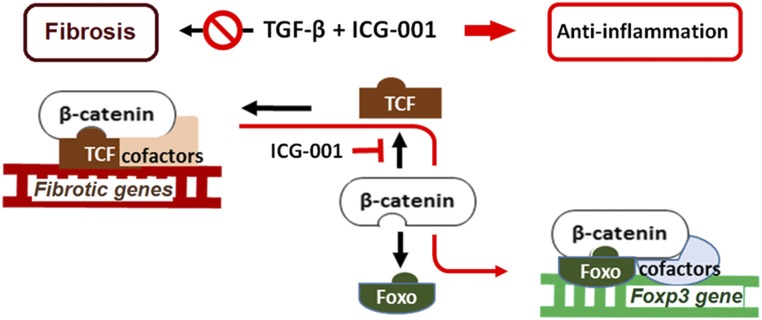
TGF-β is a key profibrotic factor, but targeting TGF-β to prevent fibrosis also abolishes its protective anti-inflammatory effects. Here, we investigated the hypothesis that we can redirect TGF-β signaling by preventing downstream profibrotic interaction of β-catenin with T cell factor (TCF), thereby enhancing the interaction of β-catenin with Foxo, a transcription factor that controls differentiation of TGF-β induced regulatory T cells (iTregs), and thus, enhance anti-inflammatory effects of TGF-β In iTregs derived from EL4 T cells treated with recombinant human TGF-β1 (rhTGF-β1) in vitro, inhibition of β-catenin/TCF transcription with ICG-001 increased Foxp3 expression, interaction of β-catenin and Foxo1, binding of Foxo1 to the Foxp3 promoter, and Foxo transcriptional activity. Moreover, the level of β-catenin expression positively correlated with the level of Foxo1 binding to the Foxp3 promoter and Foxo transcriptional activity. T cell fate mapping in Foxp3gfp Ly5.1/5.2 mice revealed that coadministration of rhTGF-β1 and ICG-001 further enhanced the expansion of iTregs and natural Tregs observed with rhTGF-β1 treatment alone. Coadministration of rhTGF-β1 with ICG-001 also increased the number of Tregs and reduced inflammation and fibrosis in the kidney fibrosis models of unilateral ureteric obstruction and ischemia-reperfusion injury. Notably, ICG-001 prevented the fibrosis in distant organs (lung and liver) caused by rhTGF-β1. Together, our results show that diversion of β-catenin from TCF- to Foxo-mediated transcription inhibits the β-catenin/TCF-mediated profibrotic effects of TGF-β while enhancing the β-catenin/Foxo-mediated anti-inflammatory effects. Targeting β-catenin/Foxo may be a novel therapeutic strategy in the treatment of fibrotic diseases that lead to organ failure.

Keywords: TGF-β; chronic kidney disease; fibrosis.


Figures

None
Graphical abstract
Figure 1.
Figure 1.
β-catenin controls Foxp3 expression by binding to Foxo1 in TGF-β iTregs. (A) Flow cytometry analysis of Foxp3 in rhTGF-β1 iTregs arising from CD4+CD25 T cells. (B) Representative histogram analyses of Foxp3 in rhTGF-β1 iTregs arising from EL4 cells transfected with constructs of β-catenin or F-Trcp-Ecad (β-catenin degradation chimera). (C) Representative histogram analyses of Foxp3 in rhTGF-β1 iTregs arising from EL4 cells treated with LiCl or ICG-001. MFI, mean fluorescence intensity. (D) Lysates from nuclear extracts of EL4 cells immunoprecipitated with anti-IgG, anti-Foxo1, or anti-TCF antibodies and analyzed by Western blot using an anti–β-catenin antibody. IP, immunoprecipitation; WB, Western blot. (E) ChIP results for Foxo1 association with Foxp3 regulatory elements in rhTGF-β1–induced EL4 cells after treatment with plasmids of β-catenin or F-TrCP-Ecad transfection or with ICG-001. Quantitative ChIP data are presented. Data were normalized against input DNA and are presented as fold change. *P<0.05. (F) Foxo transcription activity measured by Foxo reporter using duo luciferase assay. *P<0.05.
Figure 2.
Figure 2.
T cell fate mapping of GFPCD4+ or GFP+CD4+ T cells from Ly5.1 mice adoptively transferred into Ly5.2 mice. (A) In vivo fate mapping of iTregs. Plots are representative of three independent experiments performed in triplicate. Plots are gated on Ly5.1+ cells. Data are presented as means±SEM. Statistical significance was determined by one-way ANOVA followed by Tukey post hoc test. *P<0.05. (B) In vivo fate mapping of nTregs. Data are presented as means±SEM. Statistical significance was determined by one-way ANOVA followed by Tukey post hoc test. *P<0.05.
Figure 3.
Figure 3.
Shift of β-catenin from TCF to Foxo increases TGF-β iTregs. (A) TGF-β1 expression in the obstructed kidney of UUO mice on days 1, 3, 5, 7, and 14. Representative immunoblots of total kidney protein lysates showing increased expression of TGF-β1 protein. The bar graph shows TGF-β1 band density normalized to β-actin. Statistical significance was determined by one-way ANOVA followed by Tukey post hoc test (n=6 per group). *P<0.05. (B) Representative flow cytometry plots (gating on CD3+ CD4+ cells) showing the percentage and bar graphs showing the percentage and the absolute number of Tregs in the obstructed kidney on day 3 after UUO (one of five experiments is shown). A pool of infiltrating cells from two kidneys in each group was analyzed. Statistical significance was determined by one-way ANOVA followed by Tukey post hoc test (n=6 per group). *P<0.05. (C) Representative flow cytometry plots (gating on CD3+ CD4+ cells) and bar graphs showing the percentage of Tregs in the blood on day 7 after I/R (one of five experiments is shown). Statistical significance was determined by one-way ANOVA followed by Tukey post hoc test. All data are expressed as the means±SEM. *P<0.05; **P<0.01.
Figure 4.
Figure 4.
Shift of β-catenin from TCF to Foxo reduces inflammation. (A) Representative hematoxylin and eosin staining and quantitation of infiltrating cells in the kidney of UUO mice (n=6 per group). Original magnification, ×40. Scale bars, 50 μm. *P<0.05; **P<0.01. (B) Representative immunohistochemical staining and quantitation for macrophage infiltration (F4/80+) in the kidney of UUO mice (n=6 per group). Data are presented as means±SEM. Statistical significance was determined by one-way ANOVA followed Tukey post hoc test. Original magnification, ×20. Scale bars, 50 μm. *P<0.05; **P<0.01. (C) Representative immunofluorescence staining and quantitation of CD3+ T cell infiltration in the kidney of I/R mice (n=6 per group). Statistical significance was determined by one-way ANOVA followed by Tukey post hoc test. All data are expressed as the means±SEM. Original magnification, ×40. Scale bars, 100 μm. *P<0.05; **P<0.01. (D) Representative immunofluorescence staining and quantitation of macrophage infiltration in the kidney of I/R mice (n=6 per group). Statistical significance was determined by one-way ANOVA followed by Tukey post hoc test. All data are expressed as the means±SEM. Original magnification, ×40. Scale bars, 100 μm. *P<0.05; **P<0.01.
Figure 5.
Figure 5.
Shift of β-catenin from TCF to Foxo inhibits inflammatory and increases anti-inflammatory cytokine production via TGF-β iTregs in UUO mice. (A) Three days after UUO operation, splenocytes were stimulated with phorbol 12-myristate 13-acetate (5 ng/ml) and ionomycin (0.5 μg/ml) in the absence of Golgi stop for 4 hours, and culture supernatants were analyzed for the production of cytokines (IL-6, TNF-α, IFN-γ, IL-17A, and IL-10) using cytometric bead assay (n=6 per group per cytokine; one of two experiments is shown). (B) Serum was analyzed for the production of cytokines (IL-6, TNF-α, IFN-γ, IL-17A, and IL-10) using cytometric bead assay (n=6 per group per cytokine; one of two experiments is shown). Statistical significance was determined by one-way ANOVA followed by Tukey post hoc test. All data are expressed as the means±SEM. *P<0.05; **P<0.01.
Figure 6.
Figure 6.
Combined rhTGF-β1 and ICG-001 treatment decreases kidney fibrosis via Tregs. (A) Representative Gomori trichrome staining and quantitation in UUO mice (n=6 per group). Original magnification, ×40. (B) Representative Sirius red staining and quantitation in UUO mice (n=6 per group). All data are expressed as the means±SEM. Statistical significance was determined by one-way ANOVA followed by Tukey post hoc test. Original magnification, ×20. Scale bars, 100 μm. *P<0.05; **P<0.01. (C) Representative Gomori trichrome staining and its quantitation in I/R mice (n=6 per group). All data are expressed as the means±SEM. Statistical significance was determined by one-way ANOVA followed by Tukey post hoc test. Original magnification, ×40. Scale bars, 100 μm. *P<0.05.
Figure 7.
Figure 7.
Coadministration of ICG-001 with rhTGF-β1 inhibits rhTGF-β1–induced fibrosis in lung and liver of UUO mice. (A) Representative of Gomori trichrome–stained liver tissue. Original magnification, ×10. (B) Representative of Gomori trichrome–stained lung tissue. The bar graph shows the percentage of fibrotic area. All data are expressed as the means±SEM. Original magnification, ×10. Scale bars, 100 μm. **P<0.01.
Figure 8.
Figure 8.
β-catenin/Foxo diverts TGF-β signaling from a profibrotic to an anti-inflammatory pathway. Diagram depicting the mechanism by which TGF-β signaling can be diverted from profibrotic to anti-inflammatory by shifting β-catenin from TCF to Foxo binding (symbols and arrows in red).

References

    1. Duffield JS: Cellular and molecular mechanisms in kidney fibrosis. J Clin Invest 124: 2299–2306, 2014 - PMC - PubMed
    1. Yanagita M: Inhibitors/antagonists of TGF-β system in kidney fibrosis. Nephrol Dial Transplant 27: 3686–3691, 2012 - PubMed
    1. Border WA, Noble NA: Transforming growth factor beta in tissue fibrosis. N Engl J Med 331: 1286–1292, 1994 - PubMed
    1. Meng XM, Nikolic-Paterson DJ, Lan HY: TGF-β: The master regulator of fibrosis. Nat Rev Nephrol 12: 325–338, 2016 - PubMed
    1. Vincenti F, Fervenza FC, Campbell KN, Diaz M, Gesualdo L, Nelson P, Praga M, Radhakrishnan J, Sellin L, Singh A, Thornley-Brown D, Veronese FV, Accomando B, Engstrand S, Ledbetter S, Lin J, Neylan J, Tumlin J; Focal Segmental Glomerulosclerosis Study Group : A phase 2, double-blind, placebo-controlled, randomized study of fresolimumab in patients with steroid-resistant primary focal segmental glomerulosclerosis. Kidney Int Rep 2: 800–810, 2017 - PMC - PubMed

Publication types

MeSH terms