. 2018 Mar;29(3):841-856.
doi: 10.1681/ASN.2017040409. Epub 2017 Nov 27.

Tamm-Horsfall Protein Regulates Mononuclear Phagocytes in the Kidney

Affiliations

Tamm-Horsfall Protein Regulates Mononuclear Phagocytes in the Kidney

Radmila Micanovic et al. J Am Soc Nephrol. 2018 Mar.

Abstract

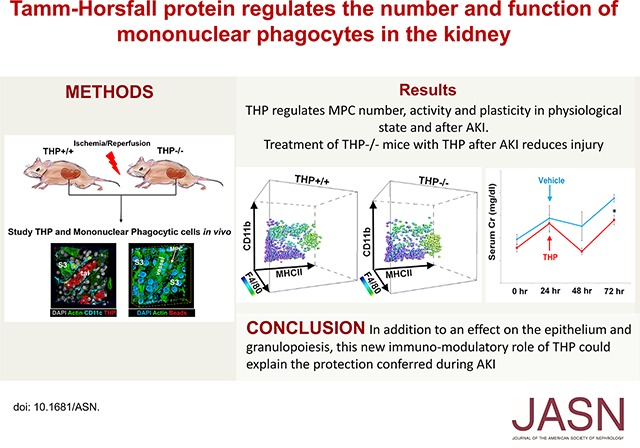
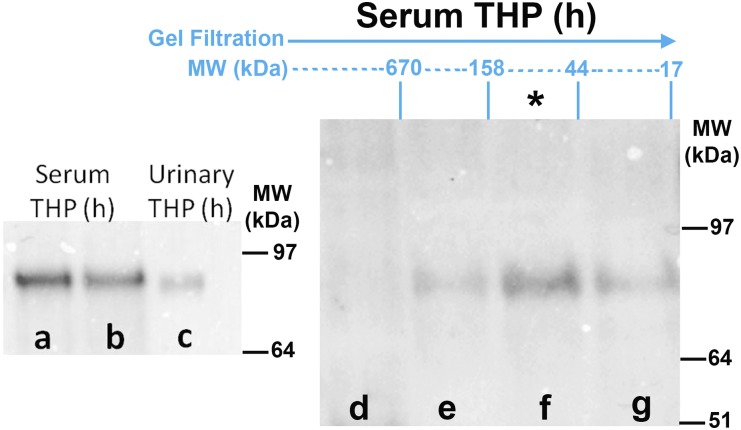
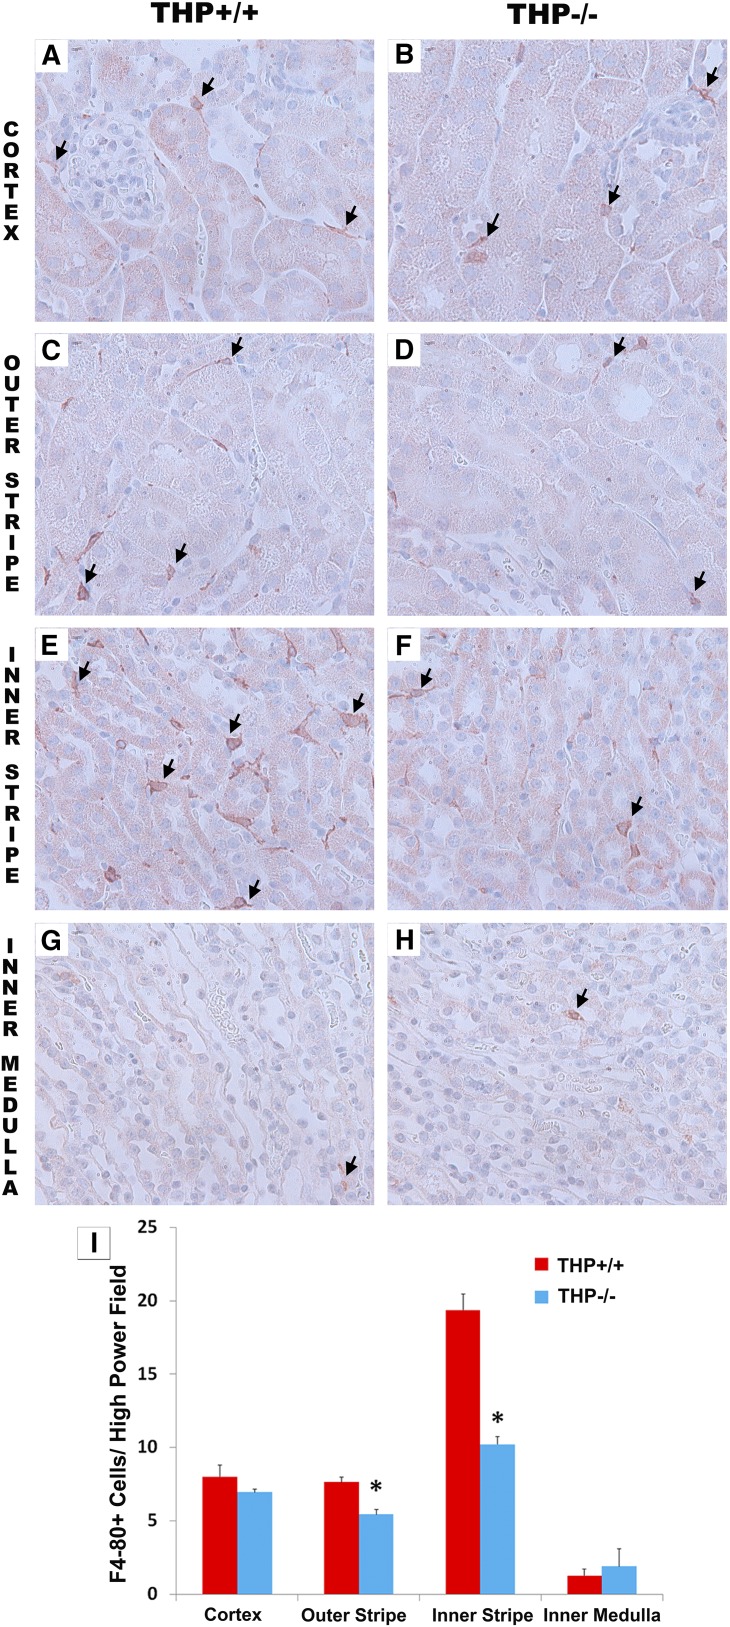
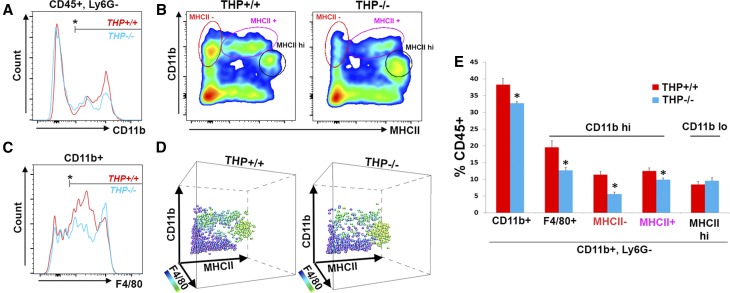
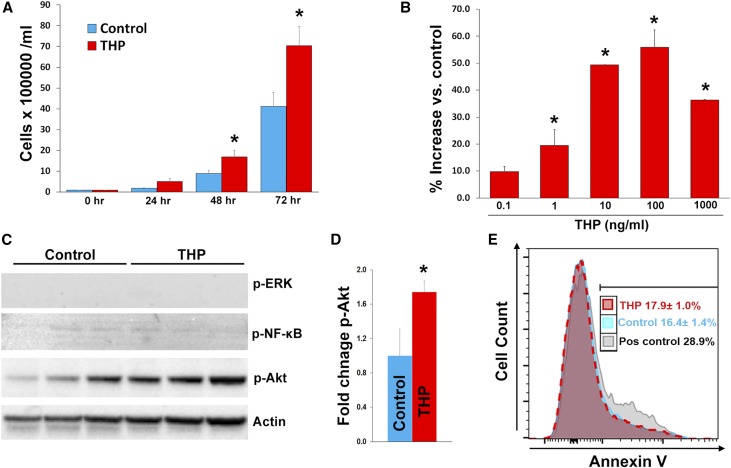
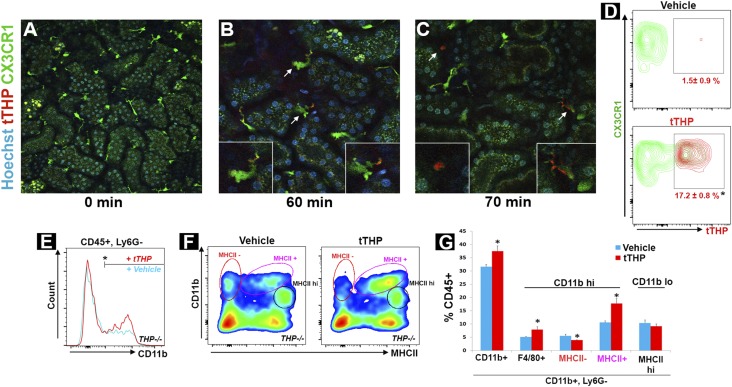
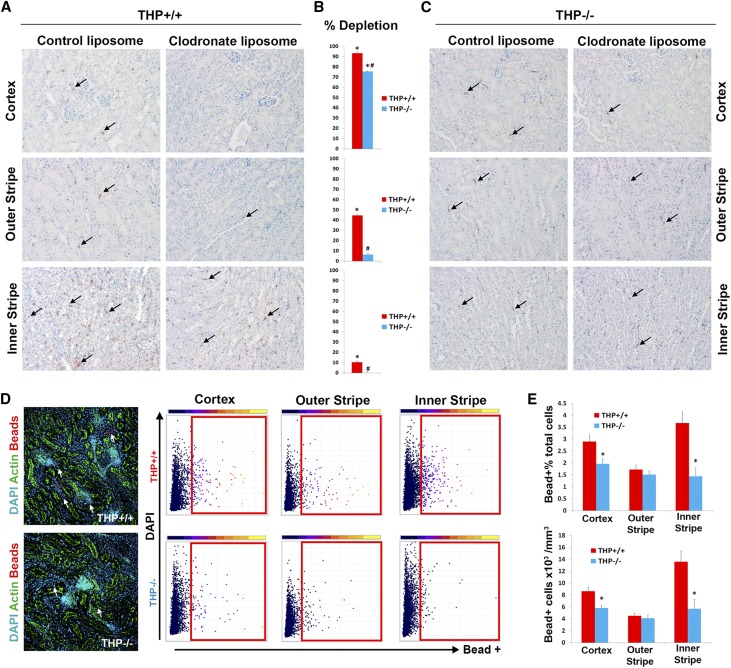
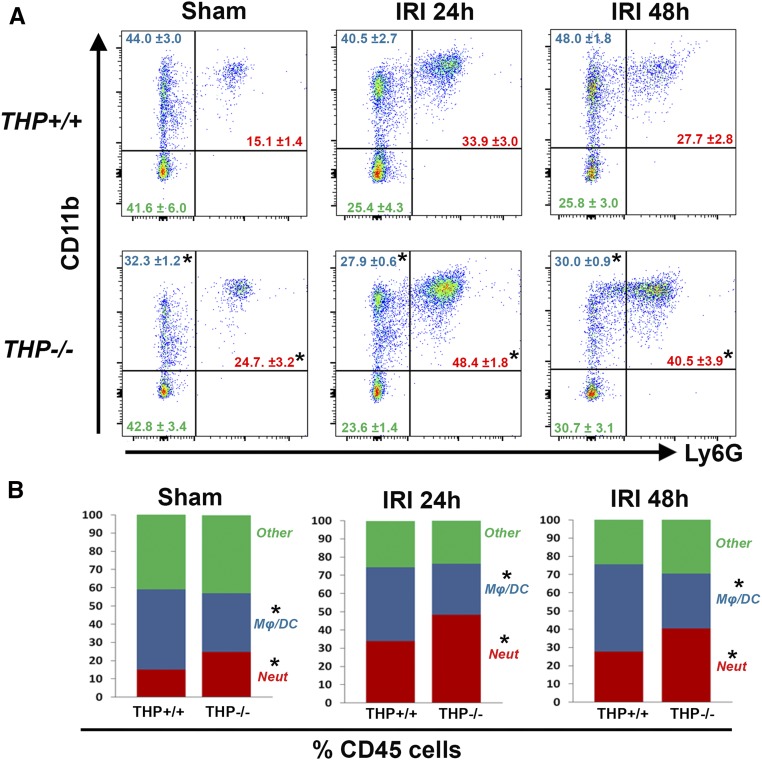
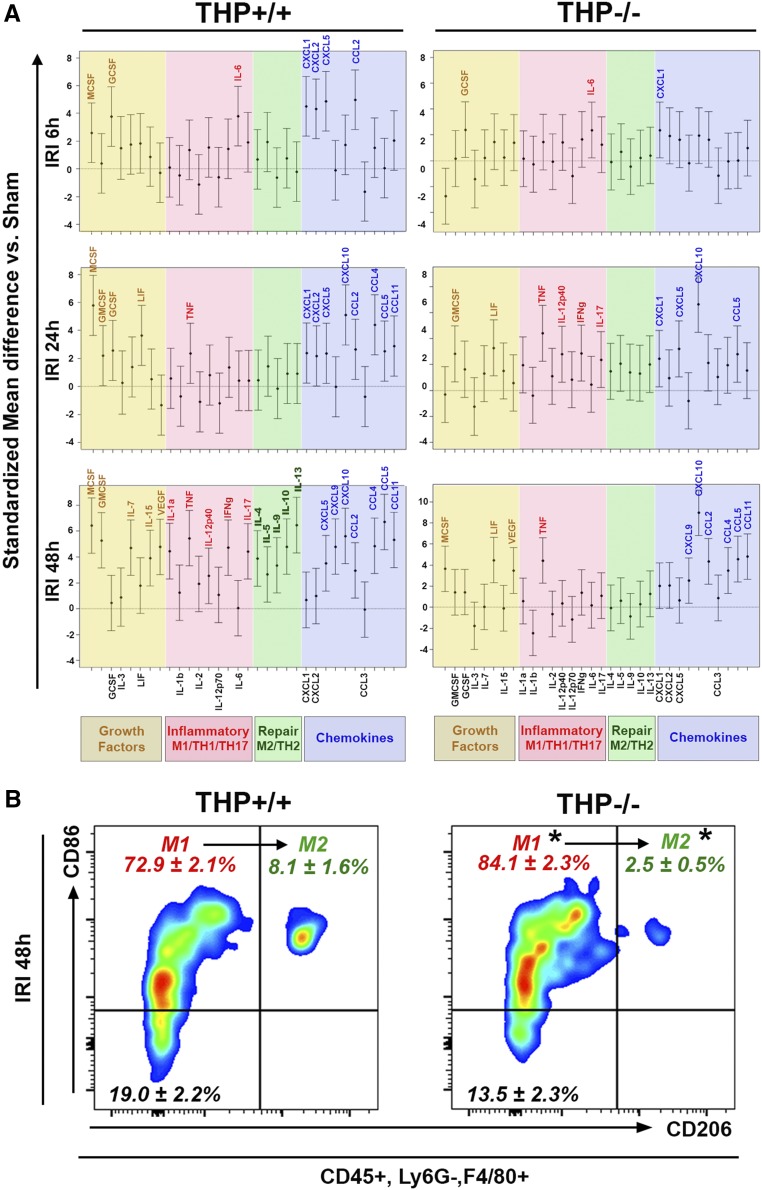
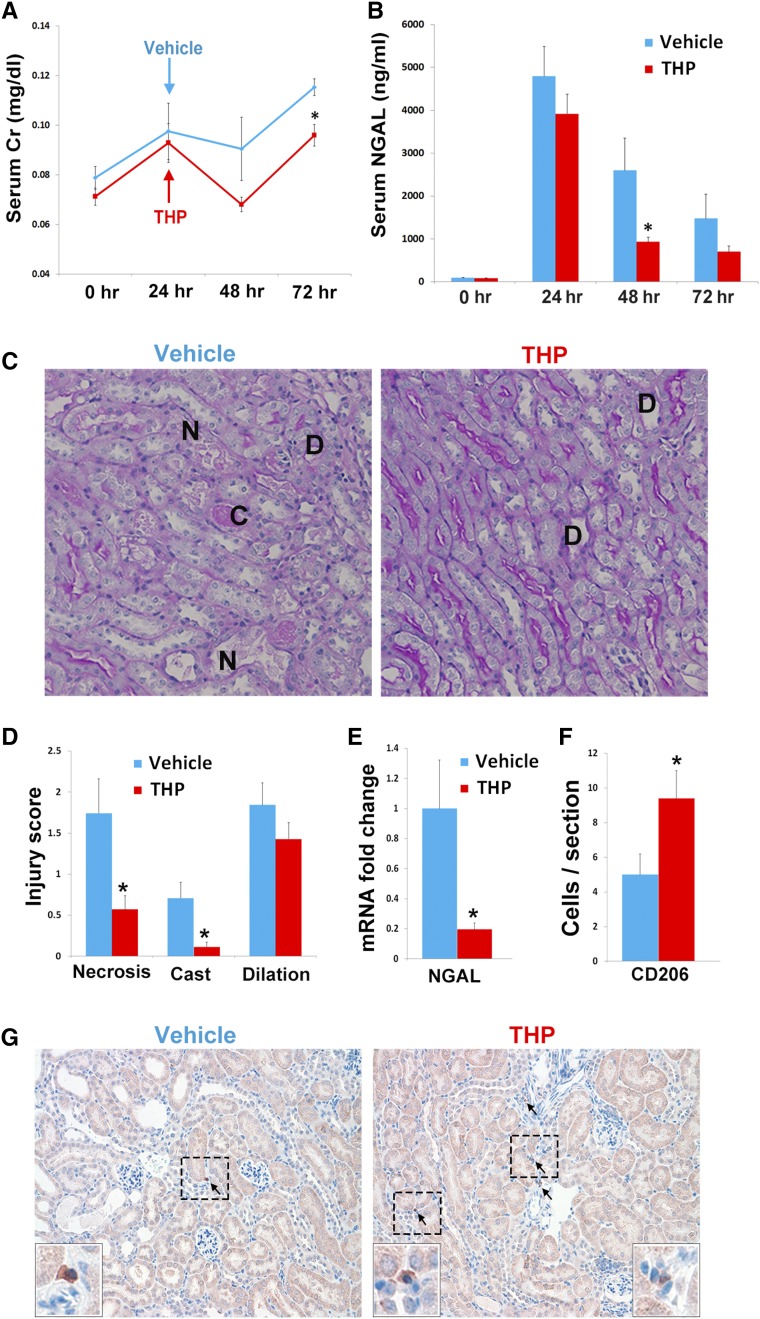
Tamm-Horsfall protein (THP), also known as uromodulin, is a kidney-specific protein produced by cells of the thick ascending limb of the loop of Henle. Although predominantly secreted apically into the urine, where it becomes highly polymerized, THP is also released basolaterally, toward the interstitium and circulation, to inhibit tubular inflammatory signaling. Whether, through this latter route, THP can also regulate the function of renal interstitial mononuclear phagocytes (MPCs) remains unclear, however. Here, we show that THP is primarily in a monomeric form in human serum. Compared with wild-type mice, THP-/- mice had markedly fewer MPCs in the kidney. A nonpolymerizing, truncated form of THP stimulated the proliferation of human macrophage cells in culture and partially restored the number of kidney MPCs when administered to THP-/- mice. Furthermore, resident renal MPCs had impaired phagocytic activity in the absence of THP. After ischemia-reperfusion injury, THP-/- mice, compared with wild-type mice, exhibited aggravated injury and an impaired transition of renal macrophages toward an M2 healing phenotype. However, treatment of THP-/- mice with truncated THP after ischemia-reperfusion injury mitigated the worsening of AKI. Taken together, our data suggest that interstitial THP positively regulates mononuclear phagocyte number, plasticity, and phagocytic activity. In addition to the effect of THP on the epithelium and granulopoiesis, this new immunomodulatory role could explain the protection conferred by THP during AKI.

Keywords: acute renal failure; ischemia-reperfusion; macrophages.


Figures

None
Graphical abstract
Figure 1.
Figure 1.
Characterization of urinary THP. (A) Electrophoresis under native conditions of various forms of THP: urinary THP purified by the method of Tamm and Horsfall (uTHP, lane a), truncated THP isolated by size exclusion chromatography (tTHP, lanes b–d), and urinary THP treated with 8 M urea (lane e). Molecular mass markers are shown in lane f. Aggregated uTHP does not undergo electrophoresis under native conditions (asterisk). Two bands of tTHP corresponding to a monomer and a dimer are observed. Multiple high–molecular mass aggregates are observed in lane e, reflecting the chaotropic effect of urea on THP multimers. (B) Western blotting of SDS-PAGE applied on to the same forms of THP is seen, with the addition of a urine sample in lane f. tTHP is now reduced to a single band, which is in the range of 64–68 kD. (C) Proteomic characterization of tTHP using MALDI-ISD maps the C-terminal sequence of tTHP to a region ending in amino acid 434, which is in the region within the two subdomains (ZP-N and ZP-C) of the ZP, with an estimated molecular mass around 65 kD. (D) Schematic representation of full-length THP and tTHP, underscoring the site of truncation at the ZP domain. MALDI-ISD, matrix-assisted laser desorption ionization-in source decay.
Figure 2.
Figure 2.
Characterization of THP in the circulation. Western blots for THP after immuno-precipitation are shown in all lanes except lane c. Lanes a and b demonstrate that THP in the human (h) serum has a comparable molecular mass (approximately 85–90 kD) to full-length human urinary THP (lane c). Lanes d–g show immuno-blotting for THP on different fractions of serum, separated according to molecular mass by size exclusion chromatography. THP is predominantly present in the fractions between 44 and 158 kD (lane f, asterisk), proving that THP in the circulation is mostly in the monomeric form.
Figure 3.
Figure 3.
THP in the kidney interstitium colocalizes with MPCs. (A) Confocal microscopy image of a kidney field in the outer medulla viewed under a 40× objective, showing a TAL intricately associated with resident mononuclear phagocytic CD11c+ cell (blue). Arrows show areas of colocalization at the basolateral domain of TAL. (B) The area marked by the asterisk is enlarged, where two distinct areas within a CD11C+ cell also show THP staining, suggesting THP uptake by these cells. (C) Electron micrograph of a TAL and a mononuclear cell in the outer medulla, whereby THP is labeled with gold particles. (D) The area marked by the arrow in (C) is enlarged, where gold-labeled THP is observed at the plasma membrane (arrowheads) and within the cytoplasm (arrows). The insets are enlarged areas marked by the asterisk and the pound sign.
Figure 4.
Figure 4.
Immunohistochemistry for F4/80 in THP+/+ and THP−/− kidneys. (A–H) Panels are representative images (40× objective) of sections (two sections/kidney, five kidneys per group) encompassing all areas within the kidney from THP+/+ and THP−/− mice. Arrows show F4/80-stained cells in various areas within the kidney. THP−/− kidneys have significant depletion of F4/80+ cells in the outer medulla. (I) Quantitation of F4/80+ cells in each renal zone (five fields for each renal zone/section). Bar graphs are mean±SEM. Asterisk represents statistical significance between the two strains (P<0.05).
Figure 5.
Figure 5.
Flow cytometry detects depletion of specific MPC population in THP−/− compared with THP+/+ kidneys. (A) Representative flow cytometry normalized cell count histograms showing the distribution of CD11b within CD45+Ly6G gated cells, in THP+/+ versus THP−/− kidneys. Bar mark denotes the positive range in the histogram. (B) Scatter plots of these cells gated for according to CD11b and MHCII intensity. (C) Distribution of F4/80 among CD11b+ cells. (D) 3D visualization of the plots from (B), with the added dimension of F4/80. The colorization corresponds to F4/80 positivity as shown in the scale bar. (E) The corresponding quantitation of the gated cells as percentage of CD45+ cells. The MPC cell population that is reduced in number in THP−/− is CD11b hi and F4/80+. Asterisk represents a statistically significant difference between THP+/+ and THP−/− (n=5 per group, P<0.05). hi, high; lo, low.
Figure 6.
Figure 6.
THP causes proliferation of SC macrophage cells and activation of Akt. Bar graphs are mean±SEM. Graph (A) shows the effect of tTHP (1 μg/ml) on the proliferation of SC cells using an automated viability assay (six replicates per group). There was significant difference of tTHP-treated versus vehicle starting 48 hours after treatment. In (B), we measured the effect of different concentrations of tTHP on cell proliferation at 48 hours. We observed a dose-dependent increase in cell number compared with control-treated cells. We then probed for the activation of ERK, NF-κB, and Akt using western blot for the phosphorylated active forms. Only Akt showed significant activation with THP treatment, which (D) was confirmed by band densitometry. (E) Flow cytometry–based PI/annexin V apoptosis assay on SC cells treated with tTHP or control. A positive control using LPS treatment of SC cells is also shown. There was no change in the rate of apoptosis (PI, annexin V+) between tTHP- and vehicle-treated SC cells. *denotes statistical significance between control and THP treatment P<0.05. Pos, positive; vs., versus.
Figure 7.
Figure 7.
Treatment with exogenous tTHP increases the number of mononuclear phagocytes. (A–C) show intravital imaging of the kidney cortex in CX3CR1-GFP+ mice, showing resident dendritic and macrophage cells labeled in green, (A) before (20× objective) and (B and C) after (60× objective) injection of tTHP labeled with Alexa 568 in red. THP was observed in the peritubular circulation and interstitium as early as 30 minutes postinjection (data not shown), and is taken up by dendritic cells and macrophages starting at 60 minutes. Insets show enlargement of the cells indicated by the arrows. Macrophages have a characteristic shape (left inset in C) and a high degree of mobility (see Supplemental Video). (D) Representative flow cytometry contour plot showing the distribution of tTHP uptake in CX3CR-GFP+ cells 1 hour after injection compared with vehicle (n=4 per group). The mean±SEM are shown for each group, and the asterisk denotes statistical significance between the groups, P<0.05. (E) Representative histogram showing the distribution of CD11b within CD45+Ly6G gated cells, in kidneys from THP−/− treated with THP or vehicle as described in the Concise Methods. (F) Scatter plots of these cells gated for according to CD11b and MHCII intensity, and (G) the corresponding quantitation of the gated cells as percentage of CD45+ cells. Asterisks represent a statistically significant difference between groups (n=5 per group, P<0.05). hi, high; lo, low.
Figure 8.
Figure 8.
Impaired phagocytic activity of renal MPCs in vivo with THP deficiency. (A and C) F4/80 immunohistochemistry (arrows pointing to F4/80+ cells) of representative kidney sections from THP+/+ or THP−/− mice (n=5 per group/treatment) treated with empty liposomes or with clodronate liposomes, respectively. (B) Bar graphs showing the percentage of F4/80 macrophage depletion with clodronate versus empty liposome of each mouse genotype in different areas of the kidney. *Statistical significance for clodronate versus control liposome; # denotes significance between THP+/+ and THP−/− (P<0.05). (D) (left) Representative z projections of image stacks spanning 50 µm, imaged with spectral confocal microscopy (20× objective), from kidney sections of THP+/+ and THP−/− mice, 90 minutes after intravenous injections of fluorescent beads. 3D tissue cytometry scatter plots are shown from each area of the kidney, with gates indicating bead+ cells. (E) Quantitation of bead+ cell abundance and density. Asterisk denotes statistical significance between the two groups (n=5 per group).
Figure 9.
Figure 9.
Flow cytometry for myeloid cells in THP+/+ and THP−/− kidneys during AKI. (A) The fluorescence distribution of CD11b and Ly6G in CD45+ gated cells. Neutrophils were defined as CD45+ CD11b+ Ly6G+, whereas macrophages/dendritic cells Mφ/DC were defined as CD45+ CD11b+ Ly6G. The distribution of cells as a percentage of CD45+ cells is shown in each quadrant, and (B) displayed using stacked bar graphs. Asterisk denotes statistical significance between THP+/+ and THP−/− (P<0.05, n=5/group per time point). Neut, neutrophils.
Figure 10.
Figure 10.
Impaired M1 to M2 macrophage phenotype switching in THP−/− mice during AKI. (A) Cytokine/chemokine multiplex ELISA array was performed on kidneys from THP−/− and THP+/+ at various time points after IRI surgery and compared with sham for each strain (n=5 per group at each timepoint). Graphs in (A) show standardized mean differences for each analyte compared with sham for each strain. Analytes are grouped on the basis of their biologic function. Statistical significance between IRI and sham for each timepoint is present when the name of the corresponding analyte is displayed on top of the confidence interval bracket. (B) Flow cytometry for M1 and M2 markers (CD86 and CD206, respectively), performed on kidney homogenates from THP+/+ and THP−/− mice, 48 hours after IRI and gated on macrophages (CD45+, Ly6G, F4/80+). Percentages of macrophages for each subgated population (mean±SEM; n=5/group) are displayed in the corresponding quadrants. Asterisk (*) denotes statistical significance between THP+/+ and THP−/− (P<0.05). vs., versus.
Figure 11.
Figure 11.
Administration of tTHP after IRI ameliorates injury: THP−/− mice were treated 24 hours after IRI with THP or vehicle. (A) Serum Cr and (B) NGAL were measured at baseline and after injury. THP-treated mice had a reduction in subsequent injury compared with vehicle. (C and D) Histologic assessment at 72 hours also shows improvement of injury (assessed by necrosis [N], casts [C], and dilation [D]). (E) This was quantitated using an injury scoring system. (D) NGAL mRNA after THP- or vehicle-treated mice. (F) Quantitative analysis of CD206+ cells (mean±SEM per kidney cross-section), and (G) representative images of CD206 immunohistochemitry. The insets are enlarged views of the areas marked within the boxes. Asterisk denotes statistical significance (P<0.05) between the two groups. n=7–8 per group. Serum Cr, creatinine.

References

    1. El-Achkar TM, Wu XR: Uromodulin in kidney injury: An instigator, bystander, or protector? Am J Kidney Dis 59: 452–461, 2012 - PMC - PubMed
    1. Rampoldi L, Scolari F, Amoroso A, Ghiggeri G, Devuyst O: The rediscovery of uromodulin (Tamm-Horsfall protein): From tubulointerstitial nephropathy to chronic kidney disease. Kidney Int 80: 338–347, 2011 - PubMed
    1. Zhu X, Cheng J, Gao J, Lepor H, Zhang ZT, Pak J, Wu XR: Isolation of mouse THP gene promoter and demonstration of its kidney-specific activity in transgenic mice. Am J Physiol Renal Physiol 282: F608–F617, 2002 - PubMed
    1. Bachmann S, Koeppen-Hagemann I, Kriz W: Ultrastructural localization of Tamm-Horsfall glycoprotein (THP) in rat kidney as revealed by protein A-gold immunocytochemistry. Histochemistry 83: 531–538, 1985 - PubMed
    1. El-Achkar TM, McCracken R, Liu Y, Heitmeier MR, Bourgeois S, Ryerse J, Wu XR: Tamm-Horsfall protein translocates to the basolateral domain of thick ascending limbs, interstitium, and circulation during recovery from acute kidney injury. Am J Physiol Renal Physiol 304: F1066–F1075, 2013 - PMC - PubMed

Publication types

MeSH terms

LinkOut - more resources