. 2018 Jan 12;293(2):687-700.
doi: 10.1074/jbc.RA117.000380. Epub 2017 Nov 27.

A hereditary spastic paraplegia-associated atlastin variant exhibits defective allosteric coupling in the catalytic core

Affiliations

A hereditary spastic paraplegia-associated atlastin variant exhibits defective allosteric coupling in the catalytic core

John P O'Donnell et al. J Biol Chem. .

Abstract

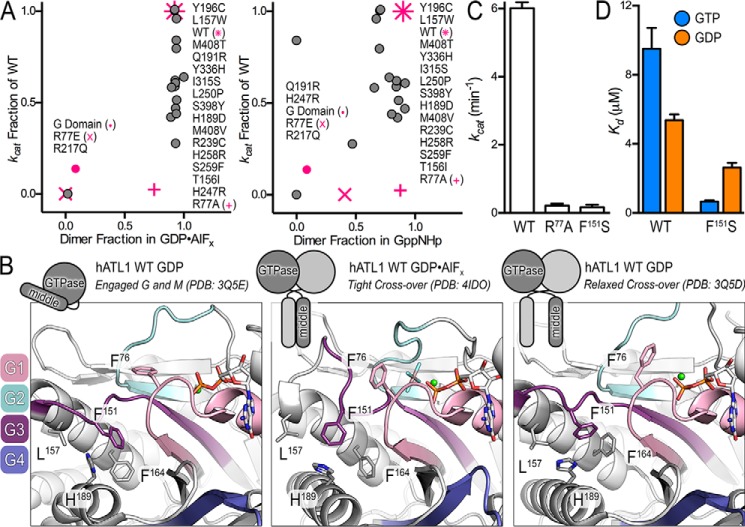
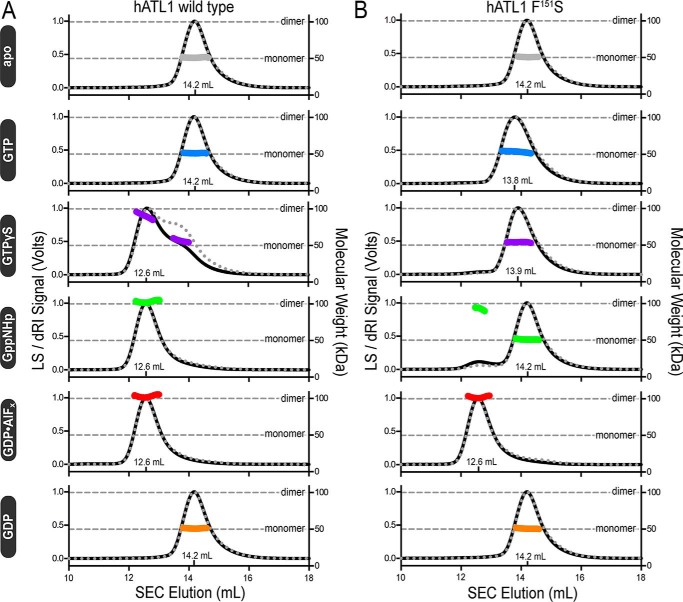
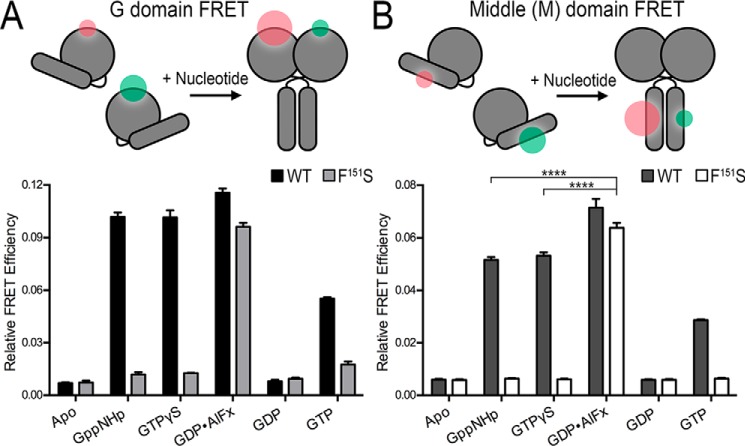
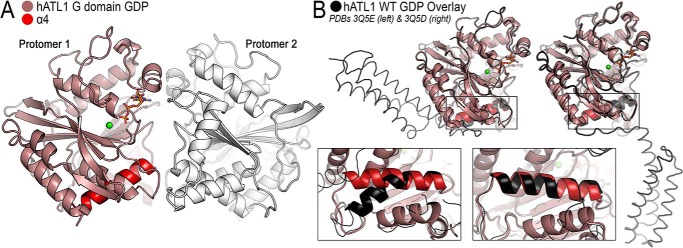
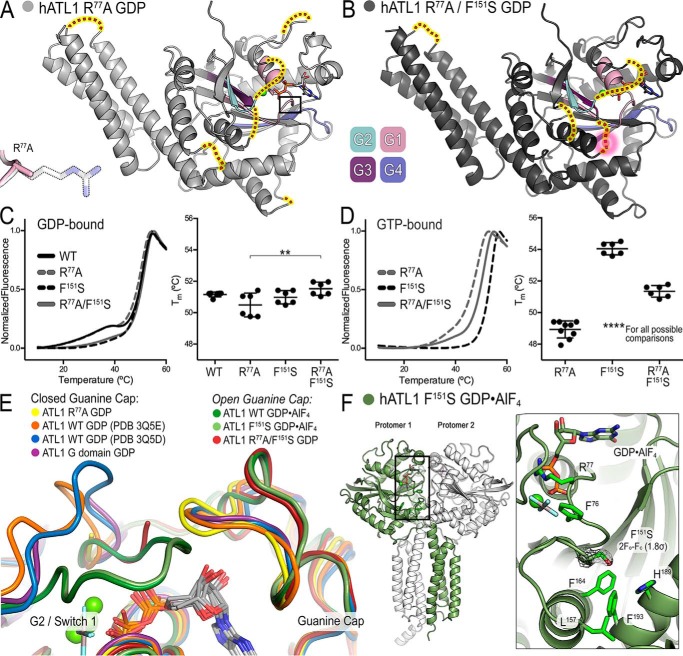
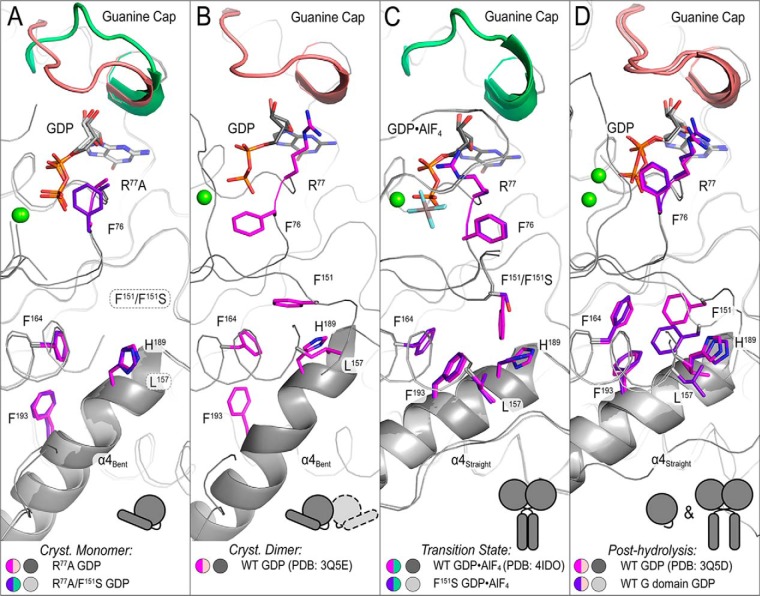
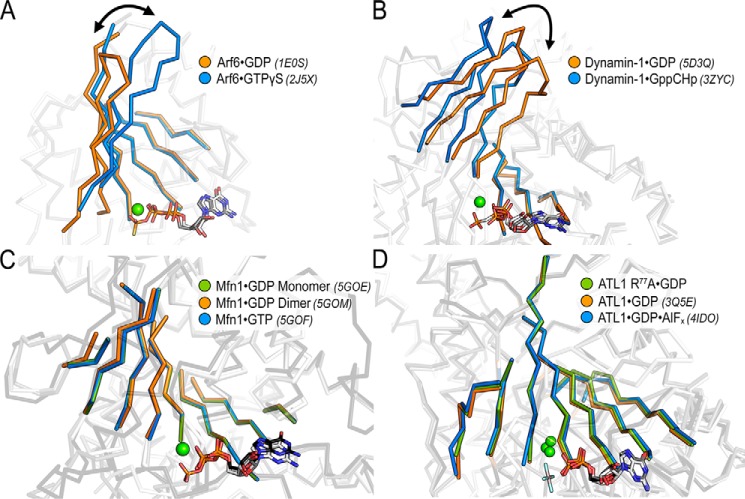
The dynamin-related GTPase atlastin (ATL) catalyzes membrane fusion of the endoplasmic reticulum and thus establishes a network of branched membrane tubules. When ATL function is compromised, the morphology of the endoplasmic reticulum deteriorates, and these defects can result in neurological disorders such as hereditary spastic paraplegia and hereditary sensory neuropathy. ATLs harness the energy of GTP hydrolysis to initiate a series of conformational changes that enable homodimerization and subsequent membrane fusion. Disease-associated amino acid substitutions cluster in regions adjacent to ATL's catalytic site, but the consequences for the GTPase's molecular mechanism are often poorly understood. Here, we elucidate structural and functional defects of an atypical hereditary spastic paraplegia mutant, ATL1-F151S, that is impaired in its nucleotide-hydrolysis cycle but can still adopt a high-affinity homodimer when bound to a transition-state analog. Crystal structures of mutant proteins yielded models of the monomeric pre- and post-hydrolysis states of ATL. Together, these findings define a mechanism for allosteric coupling in which Phe151 is the central residue in a hydrophobic interaction network connecting the active site to an interdomain interface responsible for nucleotide loading.

Keywords: GTPase; allosteric regulation; axonopathy; dynamin-related proteins; enzyme structure; hereditary spastic paraplegia; membrane fusion.


Conflict of interest statement

The authors declare that they have no conflicts of interest with the contents of this article

Figures

Figure 1.
Figure 1.
ATL1 with the atypical HSP mutation F151S is catalytically deficient but retains ability to bind nucleotide. A, re-evaluation of the correlation between GTPase activity and dimerization propensities of HSP mutations found in ATLs. B, the atypical F151S mutation is located between the active site and intramolecular domain interface responsible for nucleotide loading. Motifs characteristic of G proteins including the switch regions are shown in color. G1/P-loop (pink), G2/switch 1 (teal), G3/switch 2 (dark purple), and G4 (blue/purple) are indicated along with HSP mutations proximal to Phe151. A schematic depicting the engaged, tight cross-over, and relaxed cross-over states is shown above the panels to indicate the crystallographically determined conformations. C, turnover number (kcat) of phosphate release for wild-type ATL1, catalytically deficient ATL1-R77A mutant, and ATL1-F151S. Kinetic experiments were conducted with the soluble catalytic core fragments, comprising G and middle domains. D, affinity of wild-type and F151S-containing ATLs for GTP and GDP were calculated using mant-nucleotides. Graphs showing means and S.D. (error bars) are plotted from two biological replicates with three technical repeats each.
Figure 2.
Figure 2.
Molecular weight determination indicates that ATL-F151S only dimerizes when bound to the transition-state analog, GDP·AlFx. A, absolute molecular weights (colored data points across elution peaks are plotted on the right axis; theoretical monomer and dimer molecular weights are shown as horizontal gray lines) of wild-type ATL catalytic core fragment (injection: 40 μm ± 1 mm nucleotide) were determined using SEC-MALS (90° light scattering (black solid line) and refractive index signal (gray dotted line) are plotted on the left axis). Wild-type enzyme samples the canonical monomer/dimer states described previously (23, 26). B, SEC-MALS data for the corresponding ATL1-F151S construct using the same experimental conditions as in A. Representative data, collected on the same day, from at least two independent experiments are shown.
Figure 3.
Figure 3.
ATL1-F151S utilizes both the G and middle domains in the transition-state dimer. A, equilibrium and steady-state G domain FRET dimerization. Both wild-type and ATL1-F151S proteins were labeled site-specifically (K295C) with donor (Alexa Fluor 488) and acceptor (Alexa Fluor 647) FRET fluorophores, and measurements including 1 μm protein and 500 μm nucleotide were taken once equilibrium (GTPγS, Gpp(NH)p, GDP, or GDP·AlFx) or steady-state (GTP) conditions were fulfilled. B, equilibrium and steady-state middle domain FRET dimerization. Analogous FRET measurements were conducted with wild-type and ATL1-F151S proteins labeled site-specifically at their middle domains (K400C). ATL-F151S has a statistically higher FRET efficiency than wild-type bound to non-hydrolyzable analogs (****, p ≤ 0.0001). Graphs showing means and S.D. (error bars) are plotted from two biological replicates with three technical repeats each. Sizes of the green and red halos in the schematic diagrams (top panels) illustrate the fluorophore intensities in FRET and non-FRET states.
Figure 4.
Figure 4.
Crystal structure of the isolated G domain of ATL1 bound to GDP·Mg2+. A, the G domain structure displays weak crystal packing interactions that involve switch regions. The G domain (colored salmon), helix α4 (red), and a second protomer (white) are illustrated. B, comparison of the isolated G domain with either the engaged (PDB code 3Q5E; left) or relaxed cross-over (PDB code 3Q5D; right) structures (both black).
Figure 5.
Figure 5.
Structures of ATL1 mutants have diverse dimerization capacities and guanine cap configuration. A, ATL1-R77A bound to GDP·Mg2+ (light gray) exists in a monomeric state with G and middle domains engaged. Switch regions (G1 (pink), G2 (teal), G3 (dark purple), and G4 (blue/purple)) are largely disordered, and their hypothetical locations are indicated (red dots highlighted yellow). Inset, α-carbon backbone of loop containing R77A and the β-carbon of residue 77 are not perturbed. B, ATL1-R77A/F151S bound to GDP·Mg2+ (dark gray) also exists in a monomeric state with G and middle domains engaged. Switch regions, colored as in A, are more ordered than in the isomorphic ATL1-R77A structure, and their hypothetical locations are indicated (red dots highlighted yellow). The F151S mutation is part of the G3 switch region and is disordered in this structure; hypothetical location of the mutation is outlined by a pink halo. C, thermal melting data for wild-type ATL1, ATL1-R77A, ATL1-F151S, and ATL1-R77A/F151S bound to GDP. The Tm associated with the major unfolding phase is significantly different for ATL1-R77A and ATL1-R77A/F151S (**, p ≤ 0.01). D, thermal melting data for ATL1-R77A, ATL1-F151S, and ATL1-R77A/F151S bound to GTP. A single unfolding phase exhibits very different Tm values for the three mutant proteins (****, p ≤ 0.0001 for all possible comparisons). E, the indicated crystal structures were aligned using the G domain as a reference to observe the conformation of the guanine cap. The ATL1-R77A structure (yellow) had this loop closed onto the guanine base like other GDP·Mg2+-bound structures (orange, blue, and purple). However, both the ATL1-R77A/F151S GDP-bound (red) and the ATL1 -F151S GDP·AlF4-bound (light green) structures mirror the wild-type transition-state structure (dark green) and have a retracted guanine cap. F, ATL1-F151S bound to GDP·AlF4 (protomer 1 (green) and protomer 2 (white)) is fully capable of equilibrating into the high-affinity transition state despite the F151S mutation being buried within the core of the enzyme. 2FoFc map for the F151S mutation contoured to 1.8σ is depicted in black mesh. In C and D, melting curves showing means and Tm values showing means ± S.D. (error bars) are plotted from two biological replicates with a minimum of three technical repeats each.
Figure 6.
Figure 6.
Structure-based model for a hydrophobic interaction network that establishes interdomain allostery. Hydrophobic residues connect the active site (GDP (white/black) and guanine cap (green/salmon)) to helix α4 (schematic helix). A, structures depicting crystallographic monomers (ATL1-R77A (pink/dark gray) and ATL1-R77A/F151S (purple/light gray)) are flexible with Phe76 (in ATL1-R77A structure), F151S, and Leu157 being disordered and helix α4 bent. B, when switch regions are stabilized via homotypic crystallographic dimer contacts, the G/middle domain-engaged structure (PDB code 3Q5E, pink/dark gray) shows Phe76 rotating away from the nucleotide and Phe151 being resolved. C, both wild-type (PDB code 4IDO, pink/dark gray) and ATL1-F151S (purple/light gray) transition-state structures exhibit a switch reorganization that is accompanied with a downward rotation of Phe151 that pushes against His189 and Leu157. The helix α4 becomes straight, and Phe193, which is located at the helix's bend and may contribute energetically to helix straightening, rotates to form hydrophobic interactions with other residues labeled in this panel. D, structures resembling the post-hydrolysis state (PDB code 3Q5D (pink/dark gray) and isolated G domain (purple/light gray)) exhibit a configuration that is en route to resetting the cycle. The helix α4 remains straight, and upstream residues (Phe76 and Phe193) begin to take on conformations seen in A.
Figure 7.
Figure 7.
Evidence for nucleotide-sensing via β-sheet modulation is elusive for Mfn or ATL. A, Arf-like G proteins exhibit a nucleotide dependent registry shift in a β-sheet connecting switches 1 and 2 (Arf6·GDP (orange), PDB code 1E0S; Arf6·GTP (blue), PDB code 2J5X), enabling the release of an N-terminal helix (46, 47). B, the core β-sheet of dynamin tilts in response to nucleotide (dynamin-1·GDP (orange), PDB code 5D3Q; dynamin-1·GppCHp (blue), PDB code 3ZYC) and has been proposed to release the bundle signal element (49–51). C, the core β-sheet of mitofusin does not change in response to GDP (Mfn1·GDP monomer (green), PDB code 5GOE; Mtfn-1·GDP dimer (orange), PDB code 5GOM) or GTP (Mtf1·GTP (blue), PDB code 5GOF) (52). D, the core β-sheet of ATL also remains unperturbed between crystallographic states and various bound nucleotides (ATL1-R77A·GDP, green; ATL1·GDP, orange, PDB code 3Q5E; ATL1·GDP·AlF4, blue, PDB code 4IDO).

References

    1. Fink J. K. (2013) Hereditary spastic paraplegia: clinico-pathologic features and emerging molecular mechanisms. Acta Neuropathol. 126, 307–328 10.1007/s00401-013-1115-8 - DOI - PMC - PubMed
    1. Guelly C., Zhu P.-P., Leonardis L., Papić L., Zidar J., Schabhüttl M., Strohmaier H., Weis J., Strom T. M., Baets J., Willems J., De Jonghe P., Reilly M. M., Fröhlich E., Hatz M., et al. (2011) Targeted high-throughput sequencing identifies mutations in atlastin-1 as a cause of hereditary sensory neuropathy type I. Am. J. Hum. Genet. 88, 99–105 10.1016/j.ajhg.2010.12.003 - DOI - PMC - PubMed
    1. Fischer D., Schabhüttl M., Wieland T., Windhager R., Strom T. M., and Auer-Grumbach M. (2014) A novel missense mutation confirms ATL3 as a gene for hereditary sensory neuropathy type 1. Brain 137, e286–e286 10.1093/brain/awu091 - DOI - PubMed
    1. Hübner C. A., and Kurth I. (2014) Membrane-shaping disorders: a common pathway in axon degeneration. Brain 137, 3109–3121 10.1093/brain/awu287 - DOI - PubMed
    1. Li J., Yan B., Si H., Peng X., Zhang S. L., and Hu J. (2017) Atlastin regulates store-operated calcium entry for nerve growth factor-induced neurite outgrowth. Sci. Rep. 7, 43490 10.1038/srep43490 - DOI - PMC - PubMed

Publication types

Substances

LinkOut - more resources