. 2018 Jan 1;78(1):64-74.
doi: 10.1158/0008-5472.CAN-17-0815. Epub 2017 Nov 27.

MYC Targeted Long Noncoding RNA DANCR Promotes Cancer in Part by Reducing p21 Levels

Affiliations

MYC Targeted Long Noncoding RNA DANCR Promotes Cancer in Part by Reducing p21 Levels

Yunqi Lu et al. Cancer Res. .

Abstract

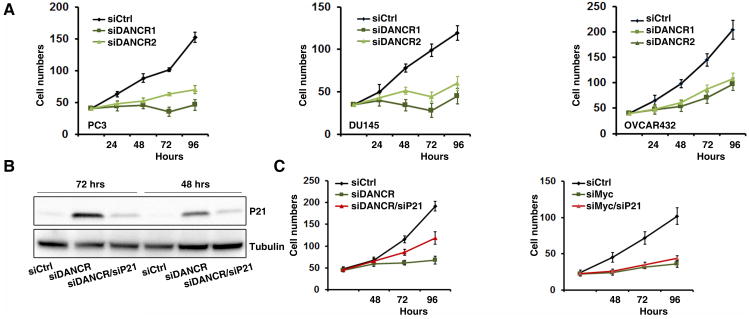
The MYC oncogene broadly promotes transcription mediated by all nuclear RNA polymerases, thereby acting as a positive modifier of global gene expression. Here, we report that MYC stimulates the transcription of DANCR, a long noncoding RNA (lncRNA) that is widely overexpressed in human cancer. We identified DANCR through its overexpression in a transgenic model of MYC-induced lymphoma, but found that it was broadly upregulated in many human cancer cell lines and cancers, including most notably in prostate and ovarian cancers. Mechanistic investigations indicated that DANCR limited the expression of cell-cycle inhibitor p21 (CDKN1A) and that the inhibitory effects of DANCR loss on cell proliferation could be partially rescued by p21 silencing. In a xenograft model of human ovarian cancer, a nanoparticle-mediated siRNA strategy to target DANCR in vivo was sufficient to strongly inhibit tumor growth. Our observations expand knowledge of how MYC drives cancer cell proliferation by identifying DANCR as a critical lncRNA widely overexpressed in human cancers.Significance: These findings expand knowledge of how MYC drives cancer cell proliferation by identifying an oncogenic long noncoding RNA that is widely overexpressed in human cancers. Cancer Res; 78(1); 64-74. ©2017 AACR.


Conflict of interest statement

Conflict-of-interest declaration: the authors have no conflict to disclose.

Figures

Figure 1
Figure 1. Identification of DANCR, an intergenic lncRNA that is broadly expressed in multiple types of cancers and regulated by MYC A
The number of the MYC-regulated (left: upregulation in MYC ON; right: downregulation in MYC ON) protein coding genes (PCGs), lncRNAs and pseudogene in P493-6 cells, lncRNAs analyzed as genic and intergenic inset. B. Percentage of lncRNAs which were co-regulated with the nearest PCGs of the MYC-regulated genic lncRNAs (left) and intergenic lncRNAs (right). C. Left: Heatmap of the expression of intergenic lncRNAs that are significantly altered due to the change of MYC expression in P439-6 cells. The experiment was repeated. Each row represents a lncRNA; each column represents a condition. The rows above the black line are lncRNAs upregulated by MYC; those below the black line are lncRNAs downregulated by MYC. Yellow, high expression; blue, low expression. Middle: Heatmap of the FPKM value of MYC-regulated lncRNAs (from left panel) in CCLE cell lines. Each row represents an intergenic lncRNA, and each column a cell line. The cell lines are grouped by cancer types, which is color-coded and numbered at the bottom of the panel. Red indicates high expression; white, low or non-detected expression. Right: Mean of FPKM of MYC-regulated lncRNAs (from left panel) in CCLE cell line collections. Five lincRNAs were expressed at high levels across multiple cancer types. D. The box plot of FPKM of SNX29P2, DANCR, and MYC in different cancer types. SNX29P2 is a B cell cancer specific intergenic lncRNA. MYC expression was also included at the top of the panel. E. The correlation between the expressions of MYC family genes and each of the five ubiquitously expressed intergenic lncRNAs in CCLE cell line panel. Left: the p value of multivariate linear regression analysis for the correlation of MYC/MYCL/MYCN and five intergenic lncRNAs. Right: Heat map of the fraction of variance of MYC-regulated intergenic lncRNA expression explained by three MYC family members. The MYC expression level shown strongest efforts on 4/5 intergenic lncRNAs (indicated by red).
Figure 2
Figure 2. DANCR is a direct MYC target gene
A. RT-PCR analysis reveals induction of DANCR in P493-6 cells by MYC activation and reduction of DANCR expression with MYC knockdown in PC3 cells. Cells were transfected with siRNA over 3h and cells were collected 24h after transfection for analysis. B. MYC ChIP-seq histograms illustrating MYC binding to DANCR as a function of time after induction of MYC in P493-6 cells (data from GEO GSE36354). C. ChIP-qPCR illustrating the binding of MYC to the DANCR locus in P493-6, PC3, and human H1 and H9 embryonic stem cells. Control represents ChIP signals from a locus located∼1.9 kb away from the DANCR transcriptional start site. D. RNA-seq analysis reveals induction of mDancr in Eμ-myc transgenic mouse model. E. MYC ChIP-seq histograms illustrating MYC binding to mDancr as a function of time after induction of MYC in Eμ-myc transgenic mouse model (data from GEO GSE51011). Error bars = SD.
Figure 3
Figure 3. Correlation of MYC and DANCR expression in human prostate cancer A
MYC and DANCR expression levels are elevated in paired tumor versus normal prostate samples from TCGA. B. RT-PCR analysis of primary human paired tumor versus normal prostate samples illustrates increased MYC and DANCR expression in tumors. C. MYC is frequently amplified in prostate cancers and DANCR is not. Degree of red corresponds to degree of amplification. D. MYC mRNA expression correlates with DANCR expression amongst human prostate cancers in TCGA.
Figure 4
Figure 4. Transcriptomic and cell cycle effects of loss of DANCR expression A
Heatmap of expression of mRNAs in response to knockdown of DANCR by siRNA (siDANCR) as compared with control (Ctrl). Blue = down-regulated. B. Gene ontology analysis of genes induced upon DANCR knockdown. C. Functional hubs of genes induced upon DANCR knockdown as analyzed by DAVID analysis on the basis of gene ontology term. D. Pulsed BrdU analysis of the cell cycle of control (left panel) and DANCR (right panel) knockdown PC3 cells. The proportions of cells in other phases were: control (G1, 41%; G2M, 25%) and siDANCR (G1, 56%; G2M, 30%). E. Induction of p21 protein with loss of DANCR expression illustrated by immunoblot for p21 at the indicated time points after siDANCR transfection. Tubulin serves as loading control. F. Inverse correlation of p21 (CDKN1A) mRNA and DANCR mRNA expression in human prostate cancers from TCGA.
Figure 5
Figure 5. Loss of DANCR expression diminishes growth of prostate and ovarian cancer cell lines A
Effects of two different siRNAs targeting DANCR (siDANCR1; siDANCR2) on growth (cell number) of PC3 and DU145 prostate or OVCAR432 ovarian cancer cells as compared with control siRNA (Ctrl). B. Induction of p21 by loss of DANCR expression and the suppression of p21 expression 48 and 72 hours after co-transfecting with siRNA targeting DANCR and p21 in PC3 cells. The immunoblot for p21 is shown with Tubulin serving as loading control. C. Diminished growth caused by siDANCR, but not by knockdown of MYC (siMYC), could be partially rescued by simultaneous knockdown of p21 expression in PC3 cells.
Figure 6
Figure 6. Therapeutic efficacy of DANCR siRNA in OVCAR432 ovarian orthotopic mouse model A
Illustration of the DANCR siRNA treatment timeline. Arrows indicate different events (yellow, cell injection; red, siRNA treatment; blue, bioluminescent imaging; green, tissue harvesting).Seven days following tumor cell injection, mice were randomly divided (10 mice per group) to receive therapy into following groups: 1) Control siRNA/DOPC or 2) DANCR1 siRNA/DOPC or 3) DANCR2 siRNA/DOPC. Nanoliposomal-siRNA nanoparticles were administered twice weekly at a dose of 150 μg/kg body weight. Representative bioluminescent images of animals receiving control and DANCR siRNAs during treatments. B. to E. Tumor weight (B), Tumor nodule (C), Ascites (D), or body weight (E) in DANCR silencing groups compared with controls. F. and G. Cell proliferation in OVCAR432 tumors. (F) Ki67 staining; (G) quantification of the proliferation rate. H. and I. Cell apoptosis in OVCAR432 tumors. (H) TUNNEL staining; (I) quantification of the apoptotic rate. Error bars indicates SEM. *P<0.05 vs. Control siRNA.

References

    1. Dang CV. MYC on the path to cancer. Cell. 2012;149:22–35. - PMC - PubMed
    1. Kress TR, Sabo A, Amati B. MYC: connecting selective transcriptional control to global RNA production. Nat Rev Cancer. 2015;15:593–607. - PubMed
    1. Wolf E, Lin CY, Eilers M, Levens DL. Taming of the beast: shaping Myc-dependent amplification. Trends Cell Biol. 2015;25:241–8. - PMC - PubMed
    1. Conacci-Sorrell M, McFerrin L, Eisenman RN. An overview of MYC and its interactome. Cold Spring Harb Perspect Med. 2014;4:a014357. - PMC - PubMed
    1. Rahl PB, Lin CY, Seila AC, Flynn RA, McCuine S, Burge CB, et al. c-Myc regulates transcriptional pause release. Cell. 2010;141:432–45. - PMC - PubMed

Publication types

Substances

LinkOut - more resources