. 2018 Jan 10;131(1):jcs205575.
doi: 10.1242/jcs.205575.

Migration against the direction of flow is LFA-1-dependent in human hematopoietic stem and progenitor cells

Affiliations

Migration against the direction of flow is LFA-1-dependent in human hematopoietic stem and progenitor cells

Alexander Buffone Jr et al. J Cell Sci. .

Erratum in

Abstract

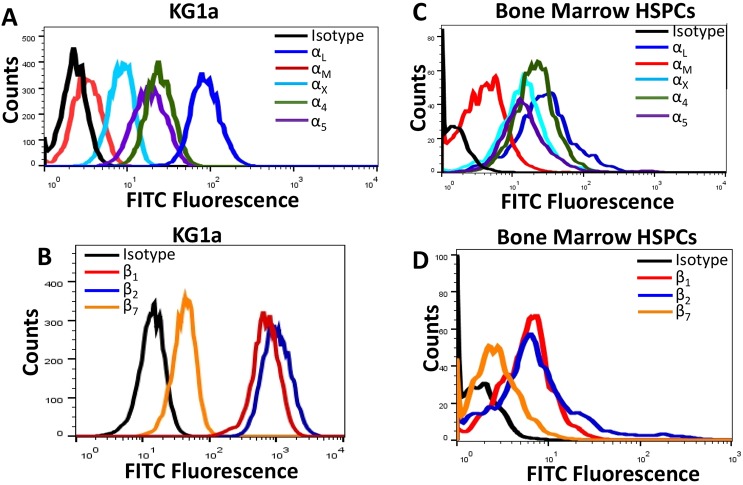
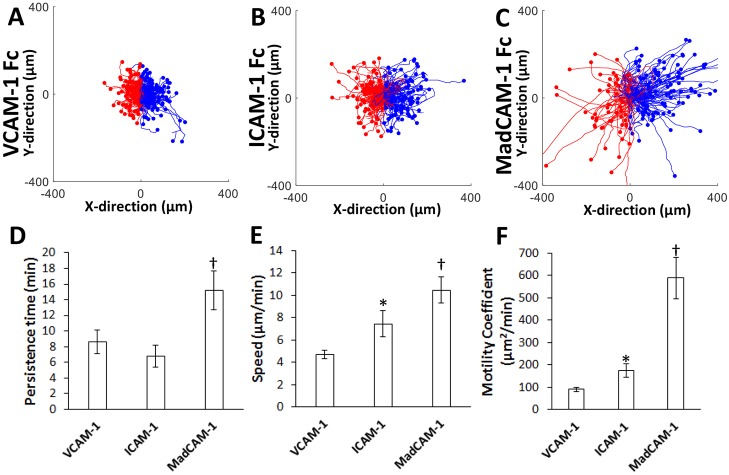
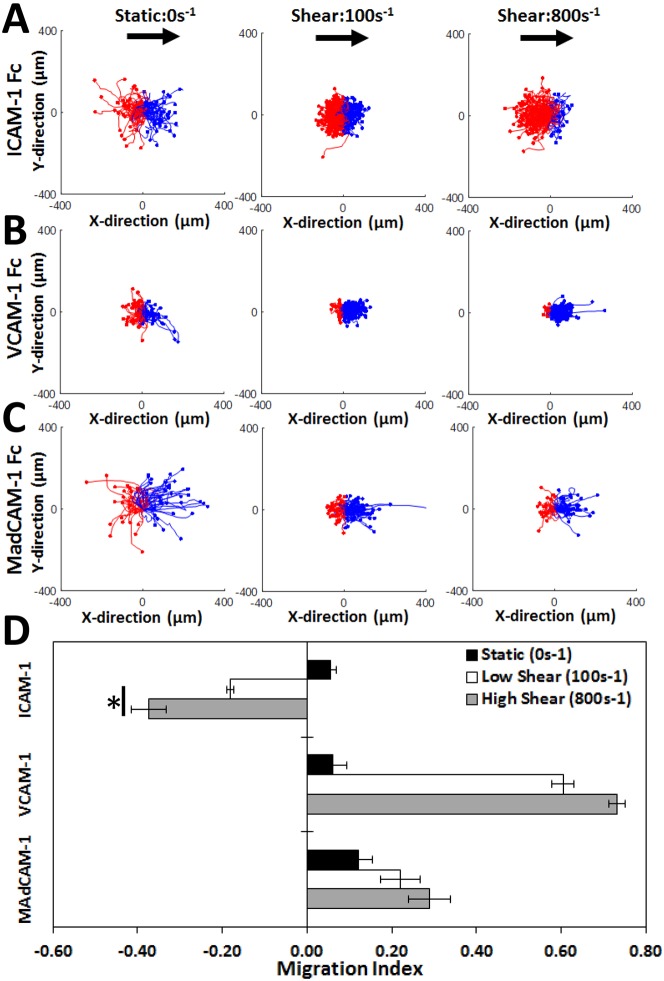
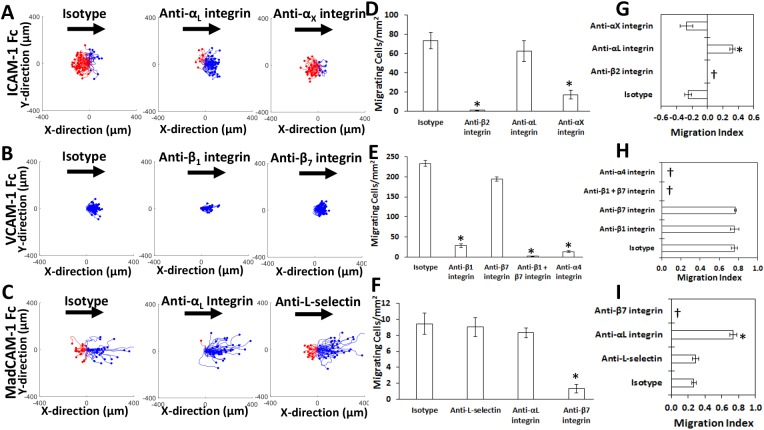
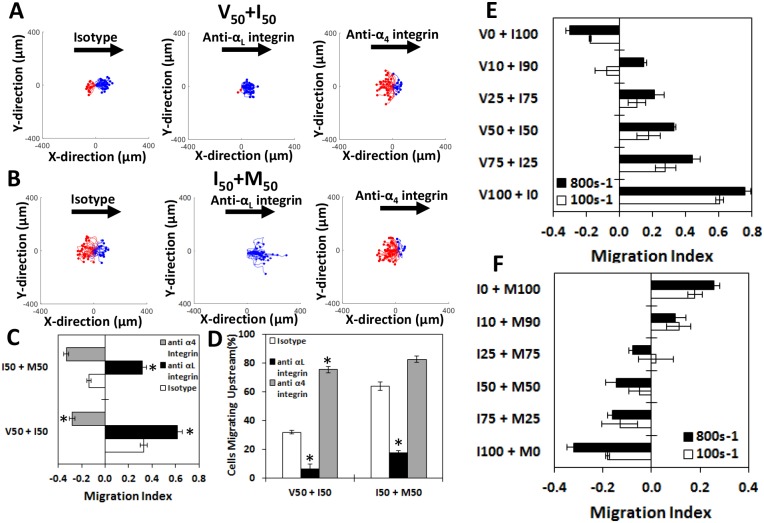
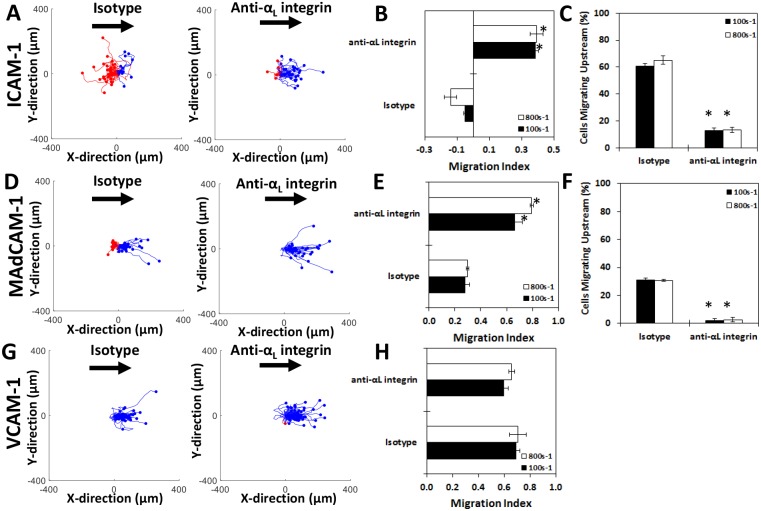
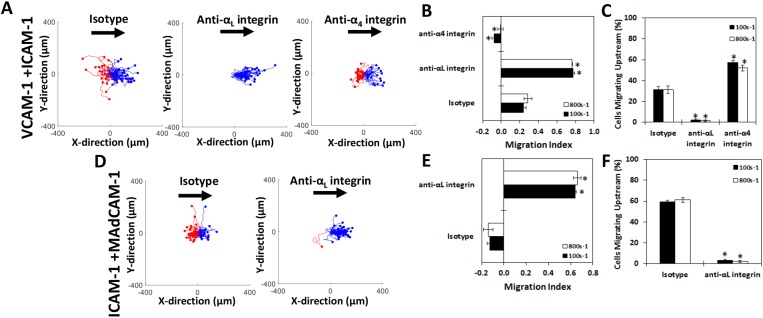
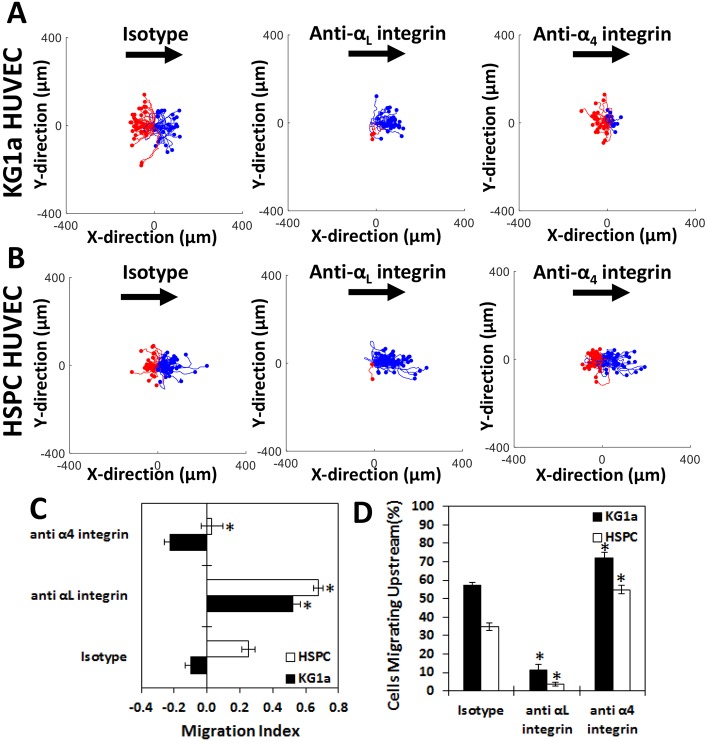
The recruitment of immune cells during inflammation is regulated by a multi-step cascade of cell rolling, activation, adhesion and transmigration through the endothelial barrier. Similarly, hematopoietic stem and progenitor cells (HSPCs) use this pathway to migrate and home to the bone marrow. After selectin-mediated braking, HSPCs migrate on adhesion ligands presented by the vascular endothelium including ICAM-1, VCAM-1 or MAdCAM-1. Here, we report that both the KG1a stem cell line and primary bone marrow CD34+ HSPCs can migrate against the direction of fluid flow on surfaces coated with cell adhesion molecules (CAMs), a behavior thus far only reported in T lymphocytes. We demonstrate that KG1a cells and primary HSPCs migrate upstream on surfaces presenting ICAM-1, downstream on surfaces presenting VCAM-1, and both upstream and downstream on surfaces presenting MAdCAM-1. In addition, we demonstrate that KG1a cells and HSPCs display upstream migration both on surfaces with multiple CAMs, as well as on human umbilical vein endothelial cell (HUVEC) monolayers. By blocking with monoclonal antibodies, we show that lymphocyte function-associated antigen-1 (LFA-1) is the key receptor responsible for upstream migration on the endothelium during the trafficking of HSPCs to the bone marrow.This article has an associated First Person interview with the first author of the paper.

Keywords: Cell migration; Endothelium; Hematopoietic stem and progenitor cell; Homing; ICAM-1; Inflammation; LFA-1; MAdCAM-1; VCAM-1.


Conflict of interest statement

Competing interestsThe authors declare no competing or financial interests.

Figures

Fig. 1.
Fig. 1.
Expression of integrin subunits on KG1a cells and primary bone marrow HSPCs. 105 KG1a cells were assayed for expression of (A,C) integrin α chains and (B,D) integrin β chains. Expression of integrins αL (dark blue), αM (red), αX (light blue), α4 (green) and α5 (purple) on (A) KG1a cells and (C) primary bone marrow HSPCs. Expression of integrins β1 (red), β2 (light blue) and β7 (yellow) on (B) KG1a cells and (D) primary bone marrow HSPCs. Isotype controls are depicted in black. In summary, these data show KG1a cells and bone marrow HPSCs express the cell-borne integrins LFA-1, VLA-4, VLA-5, LPAM-1 and αXβ2 but not Mac-1.
Fig. 2.
Fig. 2.
Motility on CAM surfaces under static conditions. Cell traces of KG1a cells under static conditions on (A) VCAM-1, (B) ICAM-1 and (C) MAdCAM-1 at a concentration of 2.5 µg/ml. The traces depicted are the cumulative tracks of three independent experiments and have units of µm. Blue traces indicate cells that traveled to the right while red traces indicate cells that traveled to the left. KG1a cells migrating along each of the three CAM surfaces had an MI of –0.05<MI<0.05 indicating random motility. In general, the area explored by KG1a in the traces follow the pattern VCAM-1<ICAM-1<MAdCAM-1. The (D) persistence time (min), (E) speed (μm/min) and (F) random motility coefficient (μm2/min) were calculated for each CAM. In all, KG1a cells the motility and speed followed the trend VCAM-1<ICAM-1<MAdCAM-1 (n=4 independent experiments of at least 70 cells analyzed per experiment for each CAM). *P<0.05 with respect to VCAM-1; P<0.05 with respect to all other CAMs (one-way ANOVA).
Fig. 3.
Fig. 3.
KG1a cells migrate upstream on ICAM-1, downstream on VCAM-1, and bi-directionally on MAdCAM-1. Cell traces of KG1A cells on (A) ICAM-1, (B) VCAM-1 and (C) MAdCAM-1 under static conditions (first column), at a shear rate of 100 s−1 (second column) or at a shear rate of 800 s−1 (third column), with a concentration of each adhesion molecule at 5 μg/ml. The traces depicted are the cumulative tracks of three independent experiments and have units of μm. Blue traces indicate cells that traveled downstream (with flow), while red traces indicate cells that traveled upstream (against flow). The direction of flow is from left to right. In general, more of the cell traces indicate upstream motion on ICAM-1 and downstream motion on VCAM-1, while motion is bi-directional on MAdCAM-1. (D) The direction of KG1a cells under shear flow as determined through the MI. A negative MI indicates migration against the flow (upstream), while a positive MI indicates migration with the flow (downstream). KG1a cells migrate upstream on ICAM-1 and this migration increases with shear rate, while KG1a cells migrate downstream on VCAM-1 surfaces and slightly downstream on MAdCAM-1 surfaces independently of shear rate. Results are mean±s.e.m. n=4–5 independent experiments of at least 60 cells analyzed per experiment for each CAM. *P<0.05 with respect to 100 s−1 shear rate (one-way ANOVA).
Fig. 4.
Fig. 4.
LFA-1 controls upstream motion while other integrins control adhesion to ICAM-1, VCAM-1 and MAdCAM-1. Cell traces of KG1a cells on (A) ICAM-1, (B) VCAM-1 and (C) MAdCAM-1 surfaces at a 800 s−1 shear rate and a ligand concentration of 5 μg/ml in response to blocking antibodies against various cell-borne ligands. The traces are the cumulative tracks of three independent experiments and have units of μm. The direction of flow is from left to right. Blocking β2 integrins (CD18) or LFA-1 (CD11a) removes the upstream motion of KG1a cells on both ICAM-1 and MAdCAM-1 surfaces. (D–F) The number of migrating cells per mm2 was calculated for each CAM. In general, adhesion to (D) ICAM-1 was β2 integrin dependent, (E) VCAM-1 was primarily β1 integrin dependent and (F) MAdCAM-1 was β7 integrin dependent. Blocking LFA-1 (CD11a) had no significant effect on number of adhesive cells. MIs for KG1a cells on (G) ICAM-1, (H) VCAM-1 and (I) MAdCAM-1. A negative MI indicates migration against the flow (upstream) while a positive MI indicates migration with the flow (downstream). Empty bars indicate samples in which too few cells adhered to the surface to calculate a MI. Blocking LFA-1 (CD11a) on ICAM-1 or MAdCAM-1 changes the MI of KG1a cells to flow from upstream or bi-directionally to completely downstream. n=4 independent experiments of at least 30 cells analyzed per experiment for each CAM. *P<0.05 with respect isotype control (one-way ANOVA); † indicates conditions with too few adherent cells were present to calculate a MI.
Fig. 5.
Fig. 5.
KG1a cells migrate upstream on mixed CAM surfaces to varying degrees. Cell traces of KG1a cells on (A) V50+I50 surfaces and on (B) I50+M50 surfaces, and (C) MI and (D) percentage of cells migrating upstream on these surfaces at a shear rate of 800 s−1. Cells migrate downstream on V50+I50 and upstream on I50+M50 surfaces. Blocking αL integrin of removes all upstream migration while blocking the α4 integrin promotes more robust upstream migration on V50+I50 and I50+M50 surfaces. MI values for KG1a cells on (E) VCAM-1+ICAM-1 and (F) ICAM-1+MAdCAM-1. A negative MI indicates migration against the flow (upstream), while a positive MI indicates migration with the flow (downstream). In general, KG1a cells migrate downstream once any VCAM-1 is introduced in VCAM-1+ICAM-1 mixtures, while they prefer to travel upstream once any ICAM-1 is introduced in ICAM-1+MAdCAM-1 mixtures. n=4 independent experiments of at least 40 cells analyzed per experiment for each CAM. *P<0.05 with respect to isotype control (one-way ANOVA).
Fig. 6.
Fig. 6.
Primary HSPCs show similar migration profiles to KG1a cells on ICAM-1, VCAM-1 and MAdCAM-1. Cell traces of bone marrow HSPCs on (A) ICAM-1, (D) MAdCAM-1 and (G) VCAM-1 under isotype (first column) or anti-αL integrin blocking (second column) at a concentration of 5 μg/ml and an 800 s−1 shear rate. Traces are the cumulative tracks of two independent experiments and have units of µm. Blue traces indicate cells that traveled downstream (with flow), while red traces indicate cells that traveled upstream (against flow). The direction of flow is from left to right. In general, most traces indicate upstream migration on ICAM-1 and downstream migration on VCAM-1 while having bi-directionality on MAdCAM-1. The direction of HSPC migration under shear flow as expressed by the MI under isotype or anti-αL integrin blocking at an 100 s−1 and 800 s−1 shear rate on (B) ICAM-1, (E) MAdCAM-1 or (H) VCAM-1. Percentage of migrating cells traveling upstream under isotype control or anti-αL integrin blocking at 100 s−1 and 800 s−1 shear rate on (C) ICAM-1 or (F) MAdCAM-1. No cells migrated upstream on VCAM-1. More HSPCs migrate upstream on ICAM-1 as flow rate increases, migrate downstream on VCAM-1 and slightly downstream on MAdCAM-1, independently of flow rate. Blocking the αL integrin of stops upstream migration on ICAM-1 and MAdCAM-1 surfaces while not affecting migration on VCAM-1. n=4–5 independent experiments of at least 40 cells analyzed per experiment for each CAM. *P<0.05 with respect to isotype conditions (Student's t-test).
Fig. 7.
Fig. 7.
Primary HSPCs behave similarly to KG1a cells on mixed CAM surfaces. Cell traces of bone marrow HSPCs on equal mixtures of (A) VCAM-1+ICAM-1 and (D) ICAM-1+MAdCAM-1 under isotype (first column), anti-αL integrin blocking (second column) or anti-α4 integrin blocking (third column) at a fixed concentration of 5 μg/ml and an 800 s−1 shear rate for the indicated surface preparations. The traces depicted are the cumulative tracks of two independent experiments and have units of μm. The direction of flow is from left to right in these traces. Most cell traces indicate travel downstream on VCAM-1+ICAM-1 surfaces and upstream on ICAM-1+MAdCAM-1. The direction of HSPC migration under shear flow as expressed by the MI under isotype or blocking conditions at 100 s−1 and 800 s−1 shear rate on (B) VCAM-1+ICAM-1 or (E) ICAM-1+MAdCAM-1. Percentage of migrating cells traveling upstream under isotype or blocking conditions at 100 s−1 and 800 s−1 shear rates on (C) VCAM-1+ICAM-1 or (F) ICAM-1+MAdCAM-1. HSPCs migrate upstream on combinations of both VCAM-1+ICAM-1 and ICAM-1+MAdCAM-1 to varying degrees. Blocking the αL integrin of stops upstream migration on both mixed surfaces while blocking the α4 integrin of enhances upstream migration on the VCAM-1+ICAM-1 surface. n=4–5 independent experiments of at least 40 cells analyzed per experiment for each CAM. *P<0.05 with respect to isotype conditions (one-way ANOVA for B,C; Students t-test E,F).
Fig. 8.
Fig. 8.
KG1a cells and HSPCs migrate upstream on endothelial monolayers. Cell traces of (A) KG1a cells and (B) bone marrow HSPCs on IL-1β-stimulated HUVECs under isotype (first column), anti-αL integrin blocking (second column) or with anti-α4 integrin blocking (third column) at an 100 s−1 shear rate. The traces depicted are the cumulative tracks of two independent experiments and have units of μm. The direction of flow is from left to right. The direction of KG1a cell and HSPC migration under shear flow as expressed by the MI (C) or percentage of migrating KG1a cell and HSPCs traveling upstream (D) under isotype, anti-αL integrin blocking or anti-α4 integrin blocking at an 100 s−1 shear rate on HUVECs. Both KG1a cells and HSPCs migrate upstream on HUVECs to varying degrees and blocking the αL integrin stops all upstream migration while blocking the α4 integrin enhances it. n=4 independent experiments of at least 60 cells analyzed per experiment. *P<0.05 with respect to isotype conditions (one-way ANOVA).

Similar articles

Cited by

References

    1. Appelbaum F. R. (2007). Hematopoietic-cell transplantation at 50. N. Engl. J. Med. 357, 1472-1475. 10.1056/NEJMp078166 - DOI - PubMed
    1. Bensinger W., Appelbaum F., Rowley S., Storb R., Sanders J., Lilleby K., Gooley T., Demirer T., Schiffman K. and Weaver C. (1995). Factors that influence collection and engraftment of autologous peripheral-blood stem cells. J. Clin. Oncol. 13, 2547-2555. 10.1200/JCO.1995.13.10.2547 - DOI - PubMed
    1. Berlin C., Berg E. L., Briskin M. J., Andrew D. P., Kilshaw P. J., Holzmann B., Weissman I. L., Hamann A. and Butcher E. C. (1993). α4β7 integrin mediates lymphocyte binding to the mucosal vascular addressin MAdCAM-1. Cell 74, 185-195. 10.1016/0092-8674(93)90305-A - DOI - PubMed
    1. Beste M. T., Lee D., King M. R., Koretzky G. A. and Hammer D. A. (2012). An integrated stochastic model of “inside-out” integrin activation and selective T Lymphocyte recruitment. Langmuir 28, 2225-2237. 10.1021/la203803e - DOI - PMC - PubMed
    1. Briskin M. J., Rott L. and Butcher E. C. (1996). Structural requirements for mucosal vascular addressin binding to its lymphocyte receptor α4β7: common themes among integrin-Ig family interactions. J. Immunol. 156, 719-726. - PubMed

Publication types

MeSH terms

Substances