. 2018 Feb;6(2):139-150.
doi: 10.1158/2326-6066.CIR-17-0134. Epub 2017 Nov 27.

Radiotherapy and CTLA-4 Blockade Shape the TCR Repertoire of Tumor-Infiltrating T Cells

Affiliations

Radiotherapy and CTLA-4 Blockade Shape the TCR Repertoire of Tumor-Infiltrating T Cells

Nils-Petter Rudqvist et al. Cancer Immunol Res. 2018 Feb.

Abstract

Immune checkpoint inhibitors activate T cells to reject tumors. Unique tumor mutations are key T-cell targets, but a comprehensive understanding of the nature of a successful antitumor T-cell response is lacking. To investigate the T-cell receptor (TCR) repertoire associated with treatment success versus failure, we used a well-characterized mouse carcinoma that is rejected by CD8 T cells in mice treated with radiotherapy (RT) and anti-CTLA-4 in combination, but not as monotherapy, and comprehensively analyzed tumor-infiltrating lymphocytes (TILs) by high-throughput sequencing of the TCRΒ CDR3 region. The combined treatment increased TIL density and CD8/CD4 ratio. Assessment of the frequency of T-cell clones indicated that anti-CTLA-4 resulted in fewer clones and a more oligoclonal repertoire compared with untreated tumors. In contrast, RT increased the CD8/CD4 ratio and broadened the TCR repertoire, and when used in combination with anti-CTLA-4, these selected T-cell clones proliferated. Hierarchical clustering of CDR3 sequences showed a treatment-specific clustering of TCRs that were shared by different mice. Abundant clonotypes were commonly shared between animals and yet treatment-specific. Analysis of amino-acid sequence similarities revealed a significant increase in the number and richness of dominant CDR3 motifs in tumors treated with RT + anti-CTLA-4 compared with control. The repertoire of TCRs reactive with a single tumor antigen recognized by CD8+ T cells was heterogeneous but highly clonal, irrespective of treatment. Overall, data support a model whereby a diverse TCR repertoire is required to achieve tumor rejection and may underlie the synergy between RT and CTLA-4 blockade. Cancer Immunol Res; 6(2); 139-50. ©2017 AACR.


Conflict of interest statement

Potential conflicts of interest: R.O.E. has full-time employment, patents and equity ownership with Adaptive Biotechnologies Corporation. H.S.R. has consultancy, patents and equity ownership with Adaptive Biotechnologies Corporation. S.C.F. has received speaker compensation from Bristol-Myer Squibb, Sanofi, Regeneron, Varian, Elekta, and Janssen, and S.D. has received honorarium from Eisai Inc., Lytix Biopharma, and Nanobiotix for advisory services.

Figures

Figure 1
Figure 1. Increased CD8/CD4 ratio and clonality of intratumoral T cells in 4T1 tumors treated with RT and anti–CTLA-4
(A) BALB/c mice were injected s.c. with 4T1 cells on day 0. Local radiotherapy (RT) was given in two fractions of 12 Gy on days 13 and 14. Anti-CTLA-4 or isotype control mAb (C4) was administered i.p. on days 15, 18 and 21 (n = 4 mice/group). At day 21, one day before tumors were harvested (†), tumor volume was 312±18.9 mm3 (control), 353±32.3 (anti–CTLA-4 mAb), 192±10.2 (RT), and 124±11.7 (RT+anti–CTLA-4). Statistical significant differences in tumor volume at day 21 determined with t-test; *** P value > 0.0005, **** P value > 0.00005, ***** P value > 0.000005 (B) Venn diagram showing minimal overlap between 2195 and 535 CDR3 sequences obtained form sorted CD4+ and CD8+ T-cells, respectively, from all 16 tumors. (C) CDR3 nucleotide sequences of sorted CD4 or CD8 T cells obtained from each treatment group were used to determine the frequencies of these T-cells in the tumor samples. Clonal analysis was restricted to those clones that could be unambiguously mapped to either CD4 or CD8 phenotype. Mean proportions from 4 tumors were computed for each treatment group. Statistical significance was determined using the Kruskall-Wallis test (* P < 0.01). (D) Correlation between sample productive clonality and CD8 composition was plotted for each tumor sample and Spearman correlation computed for each plot. Tumors were split into two equally sized portions. For one portion, DNA was extracted directly from homogenized tumor. For the other portion, DNA was isolated from sorted CD8+ T cells. Clonality was determined from unsorted portion. The CD8+ fraction was calculated as frequency of CD8+ annotated clones in unsorted portion (as determined from the CD8+ sorted cells) divided with total number of clones in the unsorted portion. (E) Clonality of sorted CD4+ and CD8+ T cells pooled within each treatment group.
Figure 2
Figure 2. Clonality and frequency distribution of intratumoral T cells clonotypes
(A) Clonality was calculated by normalizing productive Shannon entropy using the total number of unique productive rearrangements and subtracting the result from 1 (* statistical significance: p <0.05, non-parametric Mann Whitney U Test). (B) and (C) group average frequency distributions were computed. T-cell clones were ranked according to frequency for each mouse. Then, the group average frequency was calculated for each clone rank. For (B) two cumulative frequency distributions were also modeled and included in the graph to illustrate a high and low clonality distribution. For the high clonality model, clone with rank n were given a frequency of 50%/2n−1. For the low clonality model, all clones shared the frequency of 0.036% (100%/2751 clones.
Figure 3
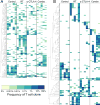
Figure 3. Hierarchical clustering (HC) of CDR3β sequences shows treatment-related clusters
Each column represents one mouse and each row a clone with unique TCRβ CDR3 AA sequence. Dendrogram represents similarity in clone abundance between animals, i.e., clones clustered together have similar abundance profile among the animals. Colors indicate productive frequency of clone. (A) HC was performed using clones present in ≥ 4 out of 20 animals in any treatment group. (B) HC was performed including only clones with ≥ 1% productive frequency in ≥ 1/20 animals to reduce noise and focus on the most abundant clones.
Figure 4
Figure 4. ImmunoMap metrics of diversity
A distance matrix based on Needleman-Wunch (NW) similarity score was calculated for all unique TCRβ CDR3 amino acid sequences. Hierarchical clustering was then performed on the distance matrix. (A) The hierarchical clustering is visualized as weighted unrooted dendrograms. Each color represents one individual animal, and the size of the circles represent frequency of a given clonotype within each animal. (B) A Dominant motif is defined as a cluster of sequences with a sequence distance below a predetermined threshold and with a cumulative frequency (sum of frequencies of sequences in cluster) ≥ 1%. Each dot represents number of dominant motifs for each individual mouse (*P < 0.05, two-tailed unpaired t-test).
Figure 5
Figure 5. CDR3 length is different between treatment groups and control
The frequency for each CDR3 region length was calculated for each mouse, and group mean was then calculated for each length. Data points and error bars represent mean + SEM (negative error bars equal positive error bars), n = 5. Using Prism, a Gaussian fit was calculated for each treatment group. The null hypothesis, “one curve that fit all treatment groups”, was rejected with a P value < 0.0001. Group average CDR3 region length ±standard deviation: Controls, 13.6±3.4; RT, 14.3±1.3; anti–CTLA-4, 14.2±0.69; RT+anti–CTLA-4, 14.3±0.92. Group average CDR3 length statistically different from controls for RT, anti–CTLA-4, and RT+anti–CTLA-4 (P values: <0.0001, 0.0012, and <0.0001, respectively).
Figure 6
Figure 6. AH1-specific CD8+ T cells are expended in tumors treated with RT+anti–CTLA4
4T1 tumors of mice treated as indicated in Fig. 1 were harvested at day 22, dissociated and TILs were isolated using Percoll gradient centrifugation. TILs were then sorted on AH1 specificity using AH1/H2-Ld pentamers. (A) Representative flow plots of TILs gated on CD45+CD8+dump cells. The percentage of cells positive for AH1/H2-Ld pentamer or the control irrelevant MCMV/H2-Ld pentamer is shown. (B) Percentage of pentamer+ cells among CD8+ TILs. Each dot represents pooled TILs from 3–4 individual animals. (***p<0.001, ****p<0.0001, one-way ANOVA). C) CD69 expression of sorted AH1-reactive CD8 T cells from 3 untreated and 3 combination-treated animals (t-test p value < 0.0001). D) Visualization of clone frequency occupancy by clone rank (based on nucleotide CDR3 sequence). Each column represents the frequency distribution of all T-cell clones within each individual animal. Color represent clone rank E) Visualization of clone frequency occupancy by clone frequency (based on nucleotide CDR3 sequence). Each column represents the frequency distribution of all clones within one individual animal. Colors designate clone frequencies, and clones are divided into groups based on frequency interval.
Figure 7
Figure 7. TCRβ CDR3 amino acid sequence distance among AH1-reactive T cells
A distance matrix based on Needleman-Wunch (NW) similarity score was calculated between 37 TCRβ CDR3 sequences of T cells sorted from peptide-vaccinated mice (yellow circles) (39, 40) and the 83 AH1-pentamer+CD8 T cells with productive frequency >1% sorted from 4T1 tumors of untreated (red circles) and RT+anti–CTLA-4 treated (gray circles) mice. Hierarchical clustering was performed on the distance matrix and visualized as a frequency weighted dendrogram. Circles size represent frequency of a given clonotype. Supplementary Fig. S2 shows the CDR3 amino acids sequences of each clone.

References

    1. Sharma P, Allison JP. Immune checkpoint targeting in cancer therapy: toward combination strategies with curative potential. Cell. 2015;161:205–14. - PMC - PubMed
    1. Van Allen EM, Miao D, Schilling B, Shukla SA, Blank C, Zimmer L, et al. Genomic correlates of response to CTLA-4 blockade in metastatic melanoma. Science. 2015;350:207–11. - PMC - PubMed
    1. Snyder A, Makarov V, Merghoub T, Yuan J, Zaretsky JM, Desrichard A, et al. Genetic basis for clinical response to CTLA-4 blockade in melanoma. N Engl J Med. 2014;371:2189–99. - PMC - PubMed
    1. Rizvi NA, Hellmann MD, Snyder A, Kvistborg P, Makarov V, Havel JJ, et al. Cancer immunology. Mutational landscape determines sensitivity to PD-1 blockade in non-small cell lung cancer. Science. 2015;348:124–8. - PMC - PubMed
    1. Schumacher TN, Schreiber RD. Neoantigens in cancer immunotherapy. Science. 2015;348:69–74. - PubMed

Publication types