. 2018 Jan;6(1):36-46.
doi: 10.1158/2326-6066.CIR-17-0211. Epub 2017 Nov 27.

High-Affinity GD2-Specific CAR T Cells Induce Fatal Encephalitis in a Preclinical Neuroblastoma Model

Affiliations

High-Affinity GD2-Specific CAR T Cells Induce Fatal Encephalitis in a Preclinical Neuroblastoma Model

Sarah A Richman et al. Cancer Immunol Res. 2018 Jan.

Abstract

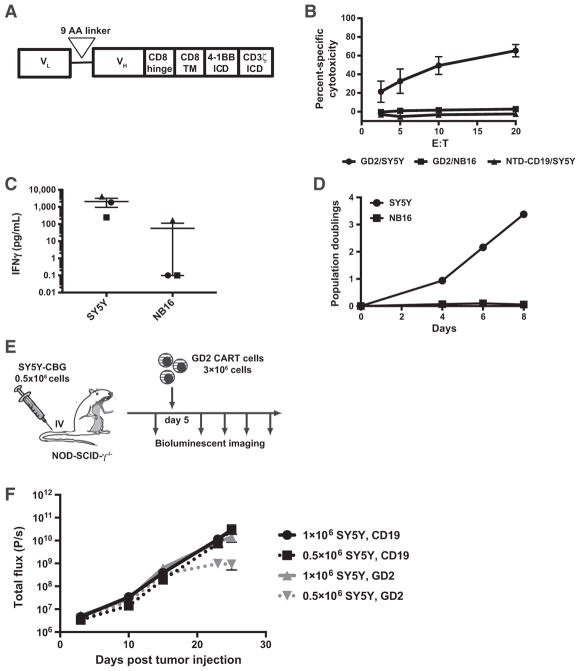
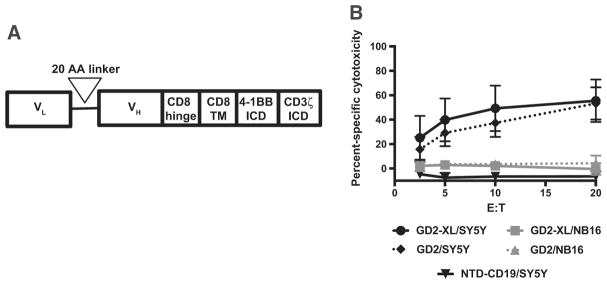
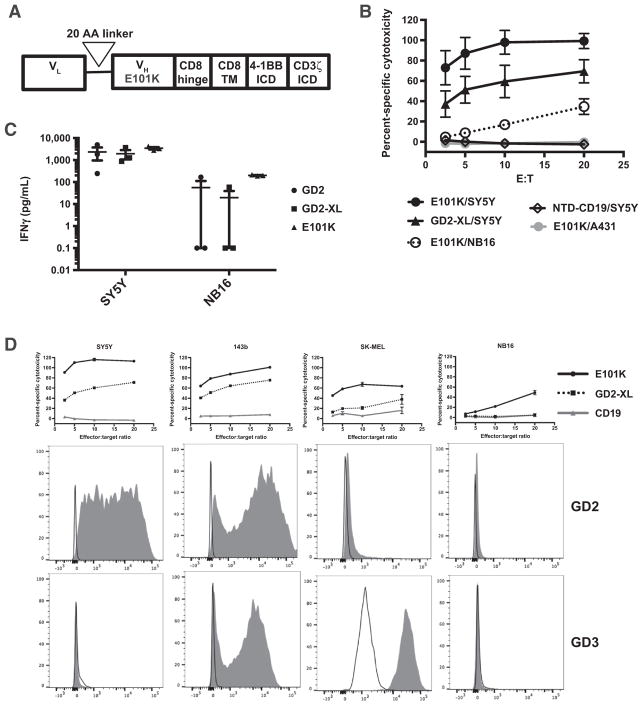
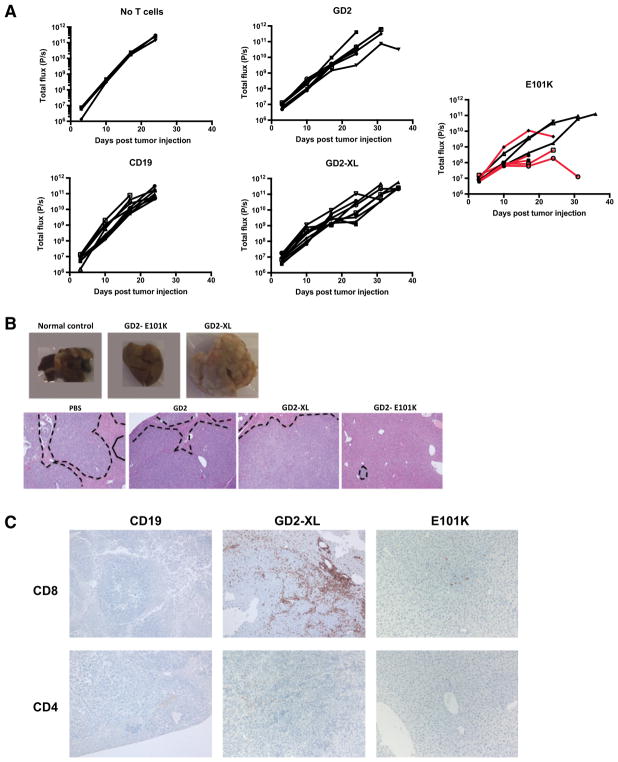
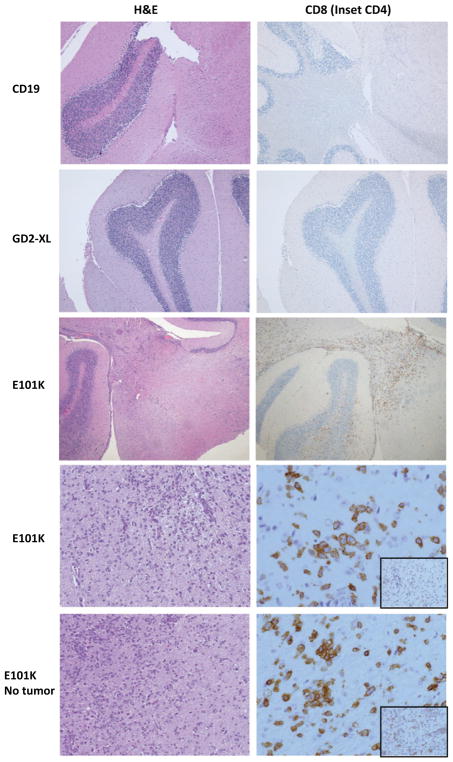
The GD2 ganglioside, which is abundant on the surface of neuroblastoma cells, is targeted by an FDA-approved therapeutic monoclonal antibody and is an attractive tumor-associated antigen for cellular immunotherapy. Chimeric antigen receptor (CAR)-modified T cells can have potent antitumor activity in B-cell malignancies, and trials to harness this cytolytic activity toward GD2 in neuroblastoma are under way. In an effort to enhance the antitumor activity of CAR T cells that target GD2, we generated variant CAR constructs predicted to improve the stability and the affinity of the GD2-binding, 14G2a-based, single-chain variable fragment (scFv) of the CAR and compared their properties in vivo We included the E101K mutation of GD2 scFv (GD2-E101K) that has enhanced antitumor activity against a GD2+ human neuroblastoma xenograft in vivo However, this enhanced antitumor efficacy in vivo was concomitantly associated with lethal central nervous system (CNS) toxicity comprised of extensive CAR T-cell infiltration and proliferation within the brain and neuronal destruction. The encephalitis was localized to the cerebellum and basal regions of the brain that display low amounts of GD2. Our results highlight the challenges associated with target antigens that exhibit shared expression on critical normal tissues. Despite the success of GD2-specific antibody therapies in the treatment of neuroblastoma, the fatal neurotoxicity of GD2-specific CAR T-cell therapy observed in our studies suggests that GD2 may be a difficult target antigen for CAR T-cell therapy without additional strategies that can control CAR T-cell function within the CNS. Cancer Immunol Res; 6(1); 36-46. ©2017 AACR.


Conflict of interest statement

Disclosure of Potential Conflicts of Interest

S.A. Grupp reports receiving a commercial research grant from Novartis and is a consultant/advisory board member for the same. M.C. Milone reports receiving a commercial research grant from Novartis. No potential conflicts of interest were disclosed by the other authors.

Figures

Figure 1
Figure 1
CAR T cells expressing the original wild-type GD2 CAR display antitumor activity in vitro but not in vivo. A, Schematic of GD2 CAR construct. B, Chromium release assay to measure specific cytotoxicity. GD2 CAR T cells were incubated with indicated targets (either GD2+ SY5Y or GD2low NB16), and nontransduced (NTD) T cells, or T cells transduced with an irrelevant CAR (CD19 CAR) were used as a control. Data show mean ± standard error of the mean (SEM) of three separate experiments using three different T-cell donors. C, CAR T cells were coincubated with target cells overnight at an E:T ratio of 10:1, and IFNγ in the supernatant was detected by IFNγ ELISA assay. Data include three separate experiments with three different T-cell donors, displayed as points along with the mean ± SEM (■, donor 1; ●, donor 2; ◆, donor 3). D, GD2 CAR T cells were incubated with irradiated targets (either SY5Y or NB16), and absolute T-cell count was measured via flow cytometric bead-based counting. The proliferation assay was performed one time in triplicate. E, Schematic representation of in vivo evaluation of GD2 CAR T cells in NSG mice injected with the SY5Y tumor cells that expressed luciferase. F, SY5Y-CBG cells (0.5 × 10⁶ or 1 × 10⁶) were injected via tail vein into NSG mice. On day 5, CD19 or GD2 CAR+ T cells (3 × 10⁶) were injected via tail vein, five mice per group. Tumor burden was assessed serially by in vivo bioluminescence before and after T-cell injection. Data show mean ± standard deviation (SD) from one experiment that was independently confirmed twice using different tumor doses and T-cell injection timing.
Figure 2
Figure 2
Lengthening of the linker between variable domains in the GD2 CAR improves activity in vitro. A, Schematic of the GD2-XL CAR construct. B, Chromium release assay to measure specific cytotoxicity, performed as described for Fig. 1. GD2 CAR T cells or GD2-XL CAR T cells were incubated with the indicated targets (either GD2+ SY5Y or GD2low NB16), and nontransduced (NTD) T cells or CD19 CAR T cells were used as a negative control. Data show mean ± standard error of the mean (SEM) of three separate experiments using three different T-cell donors.
Figure 3
Figure 3
E101K CAR T cells display enhanced in vitro antitumor activity compared with GD2 and GD2-XL CAR. A, Schematic of the E101K CAR construct. B, In vitro cytotoxic activity of GD2, GD2-XL, E101K, and CD19 CAR or NTD T cells was measured in chromium release assay as described for Fig. 1, using the indicated target cells (either the GD2+ human neuroblastoma line SY5Y, GD2low human neuroblastoma line NB16, or GD2 epidermoid carcinoma cell line A431.) Data show mean ± standard error of the mean (SEM) of three separate experiments using different three different T-cell donors. C, IFNγ secretion was measured as described for Fig. 1 after T cells were coincubated with the indicated target cells. Data include three separate experiments from three different donors, displayed along with mean ± SEM. D, Cytotoxic activity of GD2-XL CAR, E101K CAR, or NTD T cells toward different targets with varying surface levels of GD2 and GD3 was evaluated using chromium release assay as described for Fig. 1. The top row depicts percent specific cytotoxicity of CD19 (gray line), GD2-XL (dotted line), and E101K (solid line) CAR T cells from one experiment performed in triplicate. The middle and bottom rows depict flow cytometric histograms of the indicated targets stained with either antibodies to GD2 or to GD3, respectively. Unfilled histograms represent staining with isotype control.
Figure 4
Figure 4
E101K CAR T cells demonstrate enhanced ability to slow tumor growth as measured by in vivo bioluminescence as well as histologic analysis of liver tissue. SY5Y-CBG tumor cells (0.5 × 10⁶) were injected via tail vein into NSG mice. Four days later, T cells (3 × 10⁶ CAR+) expressing either the GD2 CAR, GD2-XL CAR, E101K CAR, negative control CD19 CAR, or PBS alone were injected via tail vein. Eight mice per group, except the PBS alone group, which contained 5. The data show one experiment. GD2 versus E101K was independently repeated once, and E101K versus NTD or CD19 was independently repeated an additional three times, all with similar results. Tumor burden was evaluated by in vivo bioluminescence one day prior to T-cell injection and then at multiple time points thereafter, with the last time point on surviving mice 36 days after tumor injection. A, Bioluminescence data, with each curve representing one mouse. Curves of mice receiving E101K CAR T cells that demonstrated CNS toxicity shown in red. B, Representative gross liver specimens obtained from mice from the indicated groups (top row). Representative H&E-stained sections of liver from mice in the indicated groups. C, Representative anti-human CD8 and CD4 IHC of liver sections from the indicated groups.
Figure 5
Figure 5
Serious neurotoxicity is concomitant with tumor control by E101K CAR T cells and associated with CAR T-cell infiltration into brain regions known to contain GD2. Representative H&E (left) and anti-human CD8 and CD4 IHC stained slides (right, CD4 staining is shown in the inset) of brains of mice receiving the indicated CAR T cells. (Top three rows, low power, cerebellum; bottom two rows, H&E 200×, IHC 400×.) Bottom row obtained from the E101K group that did not receive tumor.

Comment in

References

    1. Schulz G, Cheresh DA, Varki NM, Yu A, Staffileno LK, Reisfeld RA. Detection of ganglioside GD2 in tumor tissues and sera of neuroblastoma patients. Cancer Res. 1984;44:5914–20. - PubMed
    1. Cheever MA, Allison JP, Ferris AS, Finn OJ, Hastings BM, Hecht TT, et al. The prioritization of cancer antigens: a national cancer institute pilot project for the acceleration of translational research. Clin Cancer Res. 2009;15:5323–37. - PMC - PubMed
    1. Lammie G, Cheung N, Gerald W, Rosenblum M, Cordoncardo C. Ganglioside gd(2) expression in the human nervous-system and in neuroblastomas – an immunohistochemical study. Int J Oncol. 1993;3:909–15. - PubMed
    1. Furukawa K, Aixinjueluo W, Kasama T, Ohkawa Y, Yoshihara M, Ohmi Y, et al. Disruption of GM2/GD2 synthase gene resulted in overt expression of 9-O-acetyl GD3 irrespective of Tis21. J Neurochem. 2008;105:1057–66. - PMC - PubMed
    1. Svennerholm L, Bostrom K, Fredman P, Jungbjer B, Lekman A, Mansson JE, et al. Gangliosides and allied glycosphingolipids in human peripheral nerve and spinal cord. Biochim Biophys Acta. 1994;1214:115–23. - PubMed

Publication types

MeSH terms