. 2018 Jan 3;38(1):245-256.
doi: 10.1523/JNEUROSCI.1775-17.2017. Epub 2017 Nov 27.

Functional Organization and Dynamic Activity in the Superior Colliculus of the Echolocating Bat, Eptesicus fuscus

Affiliations

Functional Organization and Dynamic Activity in the Superior Colliculus of the Echolocating Bat, Eptesicus fuscus

Melville J Wohlgemuth et al. J Neurosci. .

Abstract

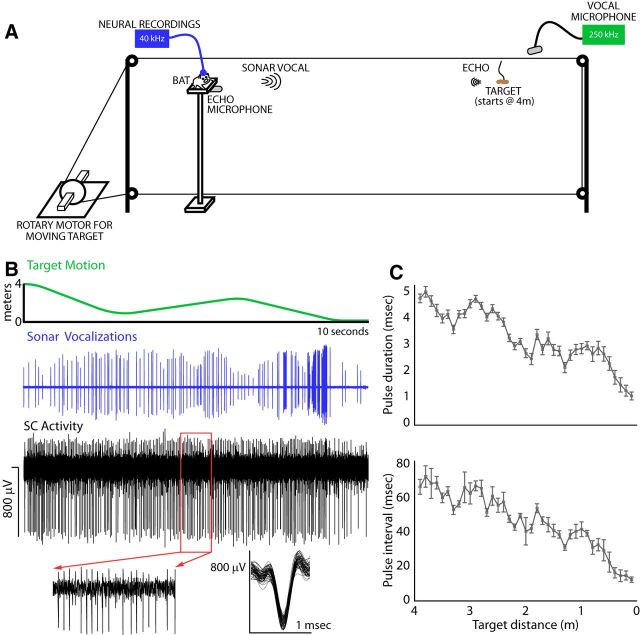
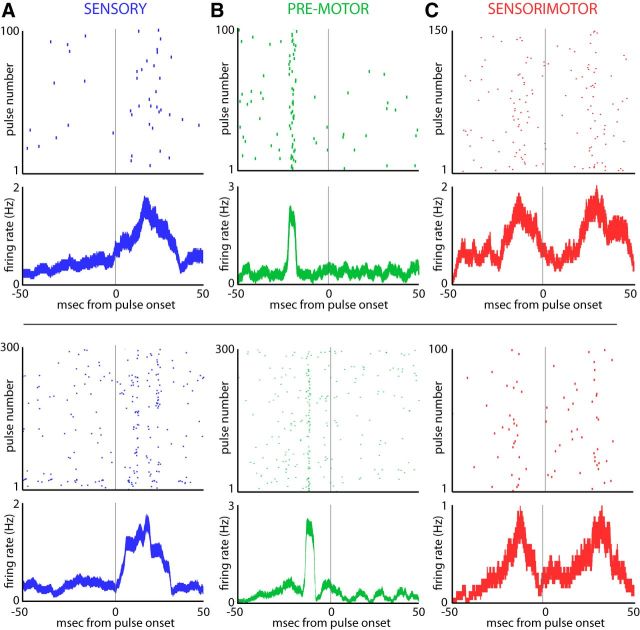
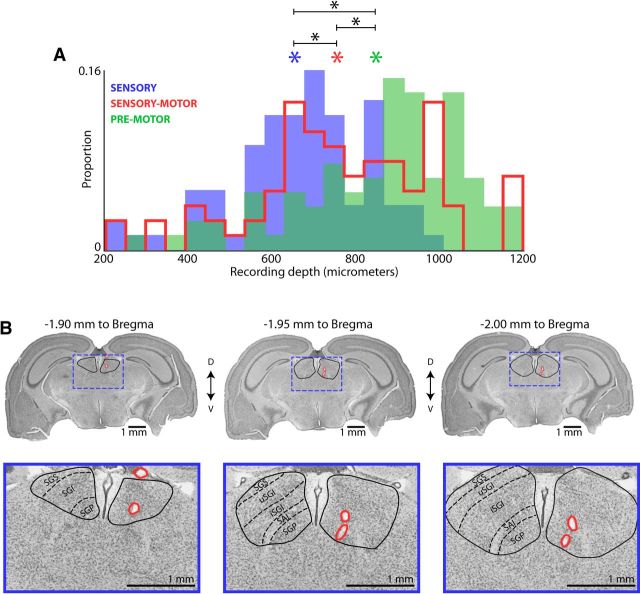
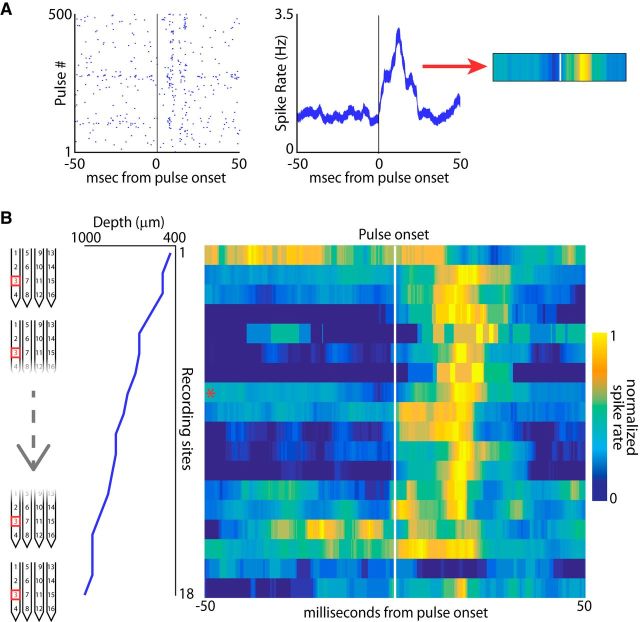
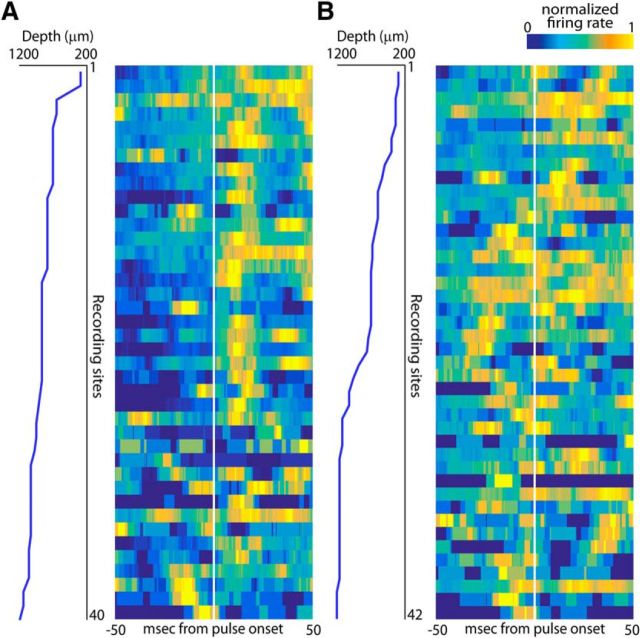
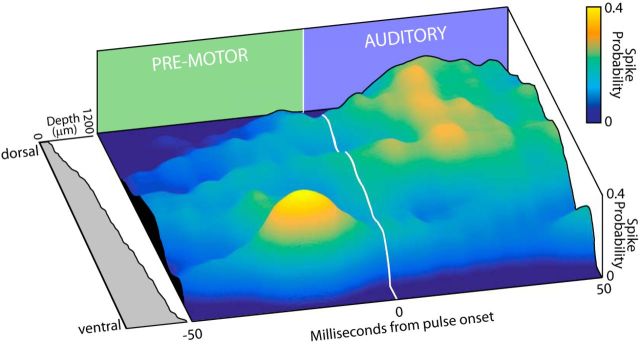
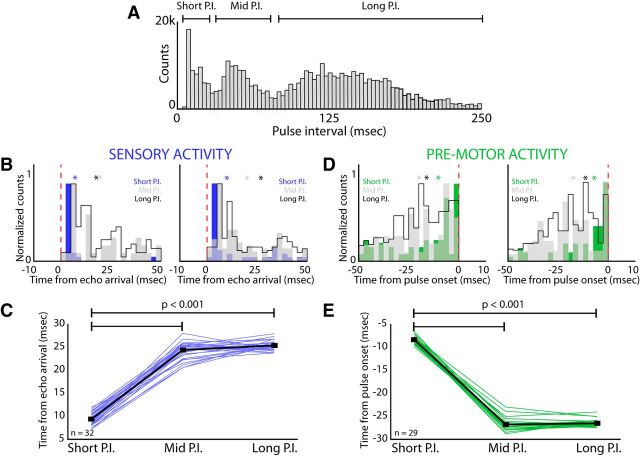
Sensory-guided behaviors require the transformation of sensory information into task-specific motor commands. Prior research on sensorimotor integration has emphasized visuomotor processes in the context of simplified orienting movements in controlled laboratory tasks rather than an animal's more complete, natural behavioral repertoire. Here, we conducted a series of neural recording experiments in the midbrain superior colliculus (SC) of echolocating bats engaged in a sonar target-tracking task that invoked dynamic active sensing behaviors. We hypothesized that SC activity in freely behaving animals would reveal dynamic shifts in neural firing patterns within and across sensory, sensorimotor, and premotor layers. We recorded neural activity in the SC of freely echolocating bats (three females and one male) and replicated the general trends reported in other species with sensory responses in the dorsal divisions and premotor activity in ventral divisions of the SC. However, within this coarse functional organization, we discovered that sensory and motor neurons are comingled within layers throughout the volume of the bat SC. In addition, as the bat increased pulse rate adaptively to increase resolution of the target location with closing distance, the activity of sensory and vocal premotor neurons changed such that auditory response times decreased, and vocal premotor lead times shortened. This finding demonstrates that SC activity can be modified dynamically in concert with adaptive behaviors and suggests that an integrated functional organization within SC laminae supports rapid and local integration of sensory and motor signals for natural, adaptive behaviors.SIGNIFICANCE STATEMENT Natural sensory-guided behaviors involve the rapid integration of information from the environment to direct flexible motor actions. The vast majority of research on sensorimotor integration has used artificial stimuli and simplified behaviors, leaving open questions about nervous system function in the context of natural tasks. Our work investigated mechanisms of dynamic sensorimotor feedback control by analyzing patterns of neural activity in the midbrain superior colliculus (SC) of an echolocating bat tracking and intercepting moving prey. Recordings revealed that sensory and motor neurons comingle within laminae of the SC to support rapid sensorimotor integration. Further, we discovered that neural activity in the bat SC changes with dynamic adaptations in the animal's echolocation behavior.

Keywords: adaptive behavior; echolocation; natural vocalizations; neuroethology; sensorimotor; superior colliculus.


Figures

Figure 1.
Figure 1.
Experimental setup. A, Bat is trained to track a moving prey item from a stationary position. The prey item is suspended from a loop of monofilament wire that is connected to a rotary stepper motor that drives the wire around a set of four pulleys. The movement of the target can be controlled experimentally. While the bat tracks the moving target, ultrasonic microphones record sonar vocalizations and echoes, motion capture cameras record movements of the bat, and a 16-channel silicon probe records from the SC. B, Top, Movement of the target for one trial in which the target travels back and forth in front of the bat before eventually arriving at the animal. Middle, Oscillogram of vocalizations produced by the bat while tracking the moving target. Bottom, Raw neural recording (band-pass 600–3000 Hz) in the SC from a bat that was tracking the moving target. Bottom, Larger view of the highlighted region neural trace (left) and 100 randomly selected spikes showing spike consistency (right). C, Top, Sonar pulse duration as a function of target distance. Bottom, Sonar pulse interval as a function of target distance. Distances are binned into 10 cm bins.
Figure 2.
Figure 2.
Sensory and motor activity in the SC. A, Top, Raster and firing rate plot of activity if a single SC neuron demonstrating a sensory or auditory response. For both the raster plot and peristimulus time histogram, activity is aligned to the onset of sonar vocalizations at zero. Tick marks in the raster plot show the time of spiking with respect to vocal onset, with 100 unique vocalizations stacked vertically. For this neuron, activity occurs after sonar vocal onset when the echo arrives and is therefore an auditory responsive neuron. The firing rate plot displays the mean ± SE of the firing rate of the neuron, also aligned to sonar vocal onset. Bottom, Example of another SC neuron with a sensory response to echo arrival. B, Top, Raster and firing rate plot for an SC neuron that is active before sonar vocal onset (the zero time point). This neuron is active ∼20 ms before vocal onset and is therefore categorized as premotor. Bottom, Another example of a neuron with an increase in activity before sonar vocal onset. C, Top, Raster plot and firing rate plot of a neuron with both vocal premotor activity and a sensory response after sonar vocal onset. This neuron is therefore classified as sensorimotor. Bottom, Another example of a sensorimotor neuron.
Figure 3.
Figure 3.
SC activity across the dorsal–ventral axis. A, Histogram of sampled recording depths in the SC with sensory (blue, n = 79), sensorimotor (red, n = 80), or vocal premotor (green, n = 83) neurons. Asterisks indicate mean depth for each functional class of neuron, sensory (blue), sensorimotor (red), premotor (green). Across all pairwise comparisons, the mean depths were significantly different (two-tailed t test, sensory vs sensorimotor, p = 5.2e−5, df = 157; sensorimotor vs motor, p = 2.7e−3, df = 161; sensory vs motor, p = 1.7e−10, df = 160). B, Histological reconstruction of silicon probe tract. Left to right, Serial coronal sections arranged from rostral to caudal; the distance to bregma is indicated above each section. Lesions from silicon probe are indicated in red for each section, SC boundaries are shown with black lines, and the expanded portion of each coronal section on the bottom row are indicated in blue boxes on top row. Individual layers of the SC are also indicated in the expanded view of each coronal section on the bottom row. Identification of layers was performed by making comparisons with previous histological reconstructions in bats and other species (Covey et al., 1987; May, 2006; and Big Brown Bat Stereotaxis Brain Atlas, courtesy of E. Covey, University of Washington).
Figure 4.
Figure 4.
SC activity throughout recording depths for one channel (channel 3) of the silicon probe. A, Methodology of converting a spike raster into a heat plot for further analysis. Left, Spike raster for an SC neuron with activity after sonar vocal onset for 500 different vocalizations. Middle, Conversion of the spike raster into a firing rate plot displaying the average firing rate of the neuron with respect to the onset of the vocalization (zero time-point). The average firing rate in a 100 ms window aligned at vocal onset is then mapped onto a color spectrum from blue to yellow, with yellow representing the peak firing rate for that neuron (right, white line indicates pulse onset). B, Reconstruction of time-aligned SC activity throughout recording depths for channel 3 on the silicon probe (left column). This channel recorded different neurons at 18 locations across 600 μm of layers in the SC (middle column). Right, Average activity of each neuron recorded arranged by depth and color coded as in A with yellow representing the peak firing rate and blue the minimum firing rate. Vocal onset is indicated with the white line; asterisk indicates neuron shown in A.
Figure 5.
Figure 5.
SC activity throughout recording depths for one shank of the silicon probe for two different bats. A, Left, Recording depths for each site shown. Right, Heat map of vocal-aligned SC activity across all recording depths for one shank of the silicon probe (shank 1, Bat A). B, Left, Recording depths for each site shown. Right, Heat map of vocal-aligned SC activity across all recording depths for one shank of the silicon probe (shank 2, Bat B).
Figure 6.
Figure 6.
Sensory, sensorimotor, and vocal premotor mapping to recording depth. Shown is a reconstruction of 242 different neurons recorded across four bats, with spike probability in relation to sonar vocal onset arranged as a function of recording depth (left plot). Sonar vocal onset is indicated with the white line, with vocal premotor activity occurring before onset and auditory evoked activity after onset. Spiking probability is represented both as a color scale (blue to yellow) and as the height of the surface plot. In this plot, sensory evoked activity is more likely in dorsal layers and motor activity is more likely in ventral layers, but both sensory and motor activity can be found throughout the recording depths (indicated by elevations greater than zero in the surface plot).
Figure 7.
Figure 7.
Effects of vocal motor production upon sensory responses. A, Distribution of PIs while bats tracked moving targets. There was a trimodal PI distribution, resulting in three different categories of PI: short PIs of <25 ms, middle PIs of 30–60 ms, and long PIs of 75–250 ms. B, Latency from echo arrival to spike time for two sensory neurons (left and right) broken down by the PI of the ongoing vocalizations. For these two example sensory neurons, the latency from echo arrival to spike time is significantly shorter for the smallest PI category (short PI in blue, p = 0.001 for left example, p = 0.002 for right example, permutation test for both comparisons). C, Change in latency from echo arrival to spike time across the three PI categories for sensory neurons (n = 32 neurons, minimum of 50 vocalizations in each PI category; asterisks denote mean values, colors as described). There is a significant decrease in the spike latency for echoes returned from short PI vocalizations compared with the middle and long PI vocalizations (p = 0.0002 for both comparisons, two-tailed t test). D, Lead time from spike time to pulse onset for two motor neurons (left and right). For both example motor neurons, the lead time from spike time to pulse onset is significantly shorter when the bat is producing vocalizations at the shortest PI (short PI in green, p = 0.001 for left example, p = 0.02 for right example, permutation test for both comparisons; asterisks denote mean values, colors as described). E, Change in lead time from spike time to pulse onset across the three PI categories for motor neurons (n = 29 neurons, minimum of 50 vocalizations in each PI category). There is a significant decrease in spike lead time to pulse onset for short PI vocalizations compared with the middle and long PI vocalizations (p = 0.0005 for both comparisons, two-tailed t test).

Similar articles

Cited by

References

    1. Bayguinov PO, Ghitani N, Jackson MB, Basso MA (2015) A hard-wired priority map in the superior colliculus shaped by asymmetric inhibitory circuitry. J Neurophysiol 114:662–676. 10.1152/jn.00144.2015 - DOI - PMC - PubMed
    1. Beetz MJ, Hechavarría JC, Kössl M (2016) Temporal tuning in the bat auditory cortex is sharper when studied with natural echolocation sequences. Sci Rep 6:29102. 10.1038/srep29102 - DOI - PMC - PubMed
    1. Behan M, Appell PP (1992) Intrinsic circuitry in the cat superior colliculus: projections from the superficial layers. J Comp Neurol 315:230–243. 10.1002/cne.903150209 - DOI - PubMed
    1. Berson DM, Stein JJ (1995) Retinotopic organization of the superior colliculus in relation to the retinal distribution of afferent ganglion cells. Vis Neurosci 12:671–686. 10.1017/S0952523800008968 - DOI - PubMed
    1. Brandão ML, Cardoso SH, Melo LL, Motta V, Coimbra NC (1994) Neural substrate of defensive behavior in the midbrain tectum. Neurosci Biobehav Rev 18:339–346. 10.1016/0149-7634(94)90047-7 - DOI - PubMed

Publication types

LinkOut - more resources