. 2017 Nov 27;8(1):1806.
doi: 10.1038/s41467-017-01804-w.

A transcribed enhancer dictates mesendoderm specification in pluripotency

Affiliations

A transcribed enhancer dictates mesendoderm specification in pluripotency

Michael Alexanian et al. Nat Commun. .

Abstract

Enhancers and long noncoding RNAs (lncRNAs) are key determinants of lineage specification during development. Here, we evaluate remodeling of the enhancer landscape and modulation of the lncRNA transcriptome during mesendoderm specification. We sort mesendodermal progenitors from differentiating embryonic stem cells (ESCs) according to Eomes expression, and find that enhancer usage is coordinated with mesendoderm-specific expression of key lineage-determining transcription factors. Many of these enhancers are associated with the expression of lncRNAs. Examination of ESC-specific enhancers interacting in three-dimensional space with mesendoderm-specifying transcription factor loci identifies MesEndoderm Transcriptional Enhancer Organizing Region (Meteor). Genetic and epigenetic manipulation of the Meteor enhancer reveal its indispensable role during mesendoderm specification and subsequent cardiogenic differentiation via transcription-independent and -dependent mechanisms. Interestingly, Meteor-deleted ESCs are epigenetically redirected towards neuroectodermal lineages. Loci, topologically associating a transcribed enhancer and its cognate protein coding gene, appear to represent therefore a class of genomic elements controlling developmental competence in pluripotency.


Conflict of interest statement

S.O. and T.P. filed a patent about therapeutic use of cardiac-enriched lncRNAs. Patent title: “Diagnostic, prognostic and therapeutic uses of long noncoding RNAs for heart disease and regenerative medicine”; International application number: PCT/EP2014/078868; Applicant: University of Lausanne, Switzerland. The remaining authors declare no competing financial interests.

Figures
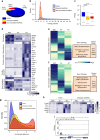
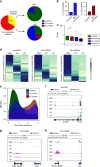
Fig. 1
Fig. 1
Global assessment of the transcriptome during mesendoderm specification. a Pie chart showing composition of the Poly (A)+ transcriptome, Protein Coding Genes (PCG, blue), Ensembl lncRNAs (yellow) and non-annotated lncRNAs (red). b Kernel density plot of coding potential (Gene ID score) of PCGs, Ensembl lncRNAs and non-annotated lncRNAs. c Box plot whiskers of transcript abundance (FPKM) of PCGs (blue), Ensembl lncRNAs (yellow) and non-annotated lncRNAs (red). p values were calculated using a two-tailed t test. (****P < 0.0001). d Expression heatmap of representative PCGs in ESC, Eo and Eo +. Markers of pluripotency, Primitive Streak/Mesendoderm (PS/ME), cardiac mesoderm and early ectoderm/neuroectoderm are shown. e Hierarchical clustering of Ensembl lncRNA expression across ESC, Eo and Eo +. Enriched GO terms and example PCGs are shown to the right. f Hierarchical clustering of non-annotated lncRNA expression across ESC, Eo , and Eo +. Enriched GO terms and example PCGs are shown to the right. g Kernel density plot of the specificity of PCG and lncRNA assessed by quantifying the normalized difference of expression in the three conditions (ESC, Eo , Eo +). h Co-activation of selected PCGs and divergent lncRNAs involved in ME specification. i RNAseq reads in ESC, Eo and Eo + at the Lhx1 locus. A divergent lncRNA (Lhx1os) is shown
Fig. 2
Fig. 2
Non-annotated lncRNAs have unique tissue enrichment characteristics. a Clustering of Eo and Eo + enriched PCGs, Ensembl lncRNAs and non-annotated lncRNAs across adult heart and 11 non-cardiac mouse ENCODE tissues. Left-hand panels highlight individual heart-enriched transcripts in red. b Schematic illustration of the pipeline utilized to calculate the Heart Enrichment (HE) score. Eo enriched transcripts (>2FC over Eo +) and Eo + enriched transcripts (>2FC over Eo ) were defined. Percentage of heart enriched transcripts was defined by comparing the expression of Eo enriched transcripts and Eo + enriched transcripts in the adult heart vs. 11 non-cardiac tissues (The ENCODE Project Consortium, 2011). HE ratio was calculated by dividing the percentage of HE transcripts in Eo + over the percentage of HE transcripts in Eo . c HE ratio in PCGs, Ensembl lncRNAs and non-annotated lncRNAs. d The same pipeline illustrated in (b) was applied to calculate tissue enrichment ratio for 12 mouse ENCODE tissues. Double gradient heatmap showing tissue enrichment ratio for the 12 mouse ENCODE tissues. e Strand-specific RNAseq data from 12 ENCODE tissues is shown for an example non-annotated lncRNA enriched in Eo +
Fig. 3
Fig. 3
Characterization of the enhancer landscape during mesendoderm specification. a Distribution of H3K27Ac identifies TEs and SEs in ESC, Eo and Eo +. Sox2 SE and Id3 SE are indicated as representative SEs b H3K27Ac signal (normalized by length) at constituent enhancers within TEs and SEs. Box plot whiskers show median value and 10–90 percentiles. p values were calculated using a one-way ANOVA test. (****P < 0.0001). c Length (Kb) of active TE and SE regions in ESC, Eo and Eo +. Median value and 10–90 percentiles are represented. p values were calculated using a two-tailed t test. (****P < 0.0001). d Heatmap showing active (blue) and inactive (white) TEs across ESC, Eo and Eo +. GO terms linked to biological processes of PCGs associated to TEs shared in all three conditions and TEs uniquely active in Eo + are shown. Examples PCGs are shown to the right. e Heatmap showing active (dark red) and inactive (white) SEs across ESC, Eo and Eo +. GO terms linked to biological processes of PCGs associated to SEs uniquely active in ESC are shown. Examples PCGs in this cluster are shown to the right. The PCGs associated to the six SEs uniquely active Eo + are shown. f Percentages of uniquely active TEs and SEs in ESC, Eo and Eo +. g Box plot whiskers of PCG expression (FPKM) of genes proximal to inactive TEs, active TEs and active SEs in ESC, Eo and Eo +. Box plot whiskers show median value and 10–90 percentiles. p values were calculated using a one-way ANOVA test. (****P < 0.0001). h Schematic of the transition from ESCs to Eo +. Cluster A: PCGs associated to TEs switched-off during the transition. Cluster B: PCGs associated to SEs switched-off during the transition. Cluster C: PCGs associated to TEs switched-on during the transition. Cluster D: PCGs associated to SEs switched-on during the transition. Cluster E: PCGs associated to TEs active during the transition. Box plot whiskers with LogFC of expression between Eo + and ESCs are shown to the right. Median value and 10–90 percentiles are represented. p values were calculated using a two-tailed t test. (****P < 0.0001)
Fig. 4
Fig. 4
Identification and characterization of promoter, typical and super enhancer associated long noncoding RNAs during mesendoderm specification. a Pie chart showing distribution of Ensembl (yellow) and non-annotated (red) lncRNAs associated with a canonical promoter signature (H3K4me3, green), typical enhancer signature (blue) or super enhancer signature (dark red). b Percentage of TE lncRNAs (blue) and SE lncRNAs (dark red) in Ensembl and non-annotated lncRNAs. c Box plot whiskers of transcript abundance (FPKM) of plncRNAs (green), SE lncRNAs (dark red), TE lncRNAs (blue) and unmarked lncRNAs (black). Box plot whiskers show median value and 10–90 percentiles. p values were calculated using a two-tailed t test. (**P < 0.01). d Hierarchical clustering of plncRNA, TE lncRNA and SE lncRNA expression across ESC, Eo and Eo +. e Kernel density plot of the specificity of plncRNAs, TE lncRNAs and SE lncRNAs assessed by quantifying the Normalized difference of expression in the three conditions (ESC, Eo , Eo +). f RNAseq and H3K4me3 reads in ESCs, Eo and Eo + cells for example plncRNA (ALIEN). g RNAseq and H3K27Ac reads in ESCs, Eo and Eo + cells for example TE lncRNA (XLOC_053874). h RNAseq and H3K27Ac reads in ESCs, Eo and Eo + cells for example SE lncRNA (XLOC_050466)
Fig. 5
Fig. 5
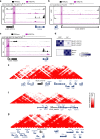
Pluripotency specific enhancer associated lncRNA loci interact with mesendodermal transcription factors. a RNAseq and H3K27Ac reads in ESCs and Eo + for Eomes and the lncRNA XLOC_073515. b RNAseq and H3K27Ac reads in ESCs and Eo + for Sox17 and the lncRNA XLOC_000012. c RNAseq and H3K27Ac reads in ESCs and Eo + for Gsc and the lncRNA XLOC_015227. d Heatmap showing expression of three lncRNAs candidates (XLOC_073515, XLOC_000012, and XLOC_015227) and their cognate PCGs (Eomes, Sox17, and Gsc) in ESCs and Eo +. e Hi–C interaction density heatmap of a genomic region where Eomes and lncRNA XLOC_073715 are centered. f Hi–C interaction density heatmap of a genomic region where Sox17 and lncRNA XLOC_000012 are centered. g Hi–C interaction density heatmap of a genomic region where Gsc and lncRNA XLOC_015227 are centered
Fig. 6
Fig. 6
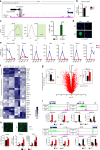
The Meteor locus controls the cell fate decision between mesendoderm and neuroectoderm. a Genomic deletion in Meteor KO cells. b Expression of Meteor lncRNA in WT and Meteor KO ESCs. Bars represent average of fold change normalized to WT. p value was calculated using a two-tailed t test. (****P < 0.0001). c GFP profile at day 0 and day 3 of differentiation in WT and Meteor KO. Percentage of GFP+ cells at day 0 and day 3 in WT and Meteor KO are shown to the right. Bars represent average of GFP + cells. p values were calculated using a two-tailed t test. (****P < 0.0001). d Anti-GFP antibody staining on day 0 colonies and day 3 EBs in WT and Meteor KO (GFP: green; DAPI: blue). Scale bar represents 50 μm. e Expression of Meteor lncRNA, Eomes, T, Mixl1, Gsc, Mesp1 and Myh7 in WT and KO cells during cardiogenic differentiation. Trends represent average of fold change normalized to WT ESC. p values were calculated using a two-way ANOVA test. (*P < 0.05; **P < 0.01; ***P < 0.001; ****P < 0.0001). f Heatmap of expression of representative PCGs in d0-d3 WT and Meteor KO cells. g Volcano plot representation of expressed PCGs in d0 WT and d0 Meteor KO. FPKM values of Lhx1 and Nkx6-3 are shown. Bars represent mean expression ± SEM. p values were calculated using a two-tailed t test. (*P < 0.05; ****P < 0.0001). h TUBB3 staining in neuronal-like day 14 WT and Meteor KO cells. (TUBB3: green; DAPI: blue). Scale bar represents 50 μm. Percentage of the TUBB3 positive area is shown below. Bars represent average of percentage. p value was calculated using a two-tailed t test. Expression of Nestin and Nefm in d0-d14 WT and Meteor KO cells. Bars represent average of fold change normalized to day0 WT. p values were calculated using a two-tailed t test. (**P < 0.01; ***P < 0.001). i H3K27Ac and H3K4me3 enrichment at enhancers and promoters of Nkx6.3, Lhx1, Neurog3 and Eomes in d0-d3 WT and Meteor KO cells. Bars represent average of percentage of input. p values were calculated using a two-tailed t test. (*P < 0.05; ***P < 0.001)
Fig. 7
Fig. 7
Assessment of Meteor functionality. a Expression measured by qRT-PCR of Meteor lncRNA and ME/Cardiac Mesoderm-related genes in P19CL6 cells following CRISPR-On-mediated Meteor lncRNA induction. Mean ± SEM (n = 6). p values were calculated using a two-tailed t test. (*P < 0.05; **P < 0.01; ***P < 0.001). b Expression measured by qRT-PCR of Meteor lncRNA, Nanog, Eomes, T, Gsc and Nkx6-3 in ESCs following transfection with siRNAs targeting Meteor lncRNA or a control sequence. Mean ± SEM (n = 3). p values were calculated using a two-tailed t test. (***P < 0.001). c Expression measured by qRT-PCR of Meteor lncRNA, Nanog, Eomes, T, Gsc and Nkx6-3 in ESCs following transfection with GapmeRs targeting Meteor lncRNA or a control sequence. Mean ± SEM (n = 3). p values were calculated using a two-tailed t test. (***P < 0.001). d Allelic expression ratios of Meteor lncRNA and Eomes from targeted RNA sequencing of 63 wild-type 129/Castaneus mESC clones. Box shows interquartile range. Whiskers show min and max. e Expression measured by qRT-PCR of Meteor lncRNA, Nanog, Eomes, T, Gsc and Nkx6-3 at day 0 in Ctrl (clone transfected with non-targeted guide RNAs) and Meteor lncRNA pAS/Cas cells. Mean ± SEM (n = 3). p values were calculated using a two-tailed t test. (****P < 0.0001). f Expression kinetic of Meteor lncRNA, Eomes, T, Lhx1, Mesp1, Myh6 and Myh7 in WT (clone transfected with non-targeting guide RNA) and Meteor lncRNA pAS/Cas cells during cardiogenic differentiation measured by qRT-PCR. Trends represent average of fold change (n = 3 biological replicates) normalized to Ctrl ESC. p values were calculated using a two-way ANOVA test. (*P < 0.05; ***P < 0.001; ****P < 0.0001). g RNAseq, H3K4me3 and H3K27Ac reads in human ESCs in the EOMES and METEOR loci. h Schematic illustration of human iPSC cardiac-directed differentiation using small molecular modulation of Wnt signaling. i Stage-specific expression kinetic of METEOR lncRNA, NANOG, EOMES, T, ISL1 and TMEM88 assayed by qRT-PCR. Trends represent average of fold change (n = 3 biological replicates) normalized to iPSC

References

    1. Kathiriya IS, Nora EP, Bruneau BG. Investigating the transcriptional control of cardiovascular development. Circ. Res. 2015;116:700–714. doi: 10.1161/CIRCRESAHA.116.302832. - DOI - PMC - PubMed
    1. Bruneau BG. Signaling and transcriptional networks in heart development and regeneration. Cold Spring Harb. Perspect Biol. 2013;5:a008292. doi: 10.1101/cshperspect.a008292. - DOI - PMC - PubMed
    1. Kuyumcu-Martinez MN, Bressan MC. Rebuilding a broken heart: lessons from developmental and regenerative biology. Development. 2016;143:3866–3870. doi: 10.1242/dev.143842. - DOI - PubMed
    1. Rao J, et al. Stepwise clearance of repressive roadblocks drives cardiac induction in human ESCs. Cell Stem Cell. 2016;18:554–556. doi: 10.1016/j.stem.2016.03.008. - DOI - PubMed
    1. Tam PP, Loebel DA. Gene function in mouse embryogenesis: get set for gastrulation. Nat. Rev. Genet. 2007;8:368–381. doi: 10.1038/nrg2084. - DOI - PubMed

Publication types

Substances