. 2017 Nov 27;7(1):16398.
doi: 10.1038/s41598-017-16300-w.

Quantitative analysis of intra- and inter-individual variability of human beta-cell mass

Affiliations

Quantitative analysis of intra- and inter-individual variability of human beta-cell mass

Scott K Olehnik et al. Sci Rep. .

Abstract

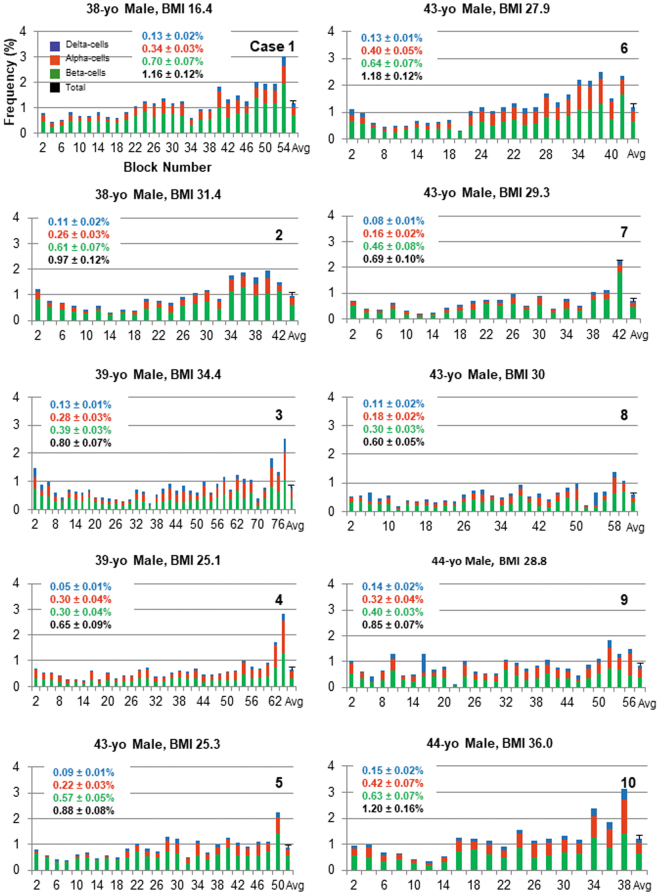
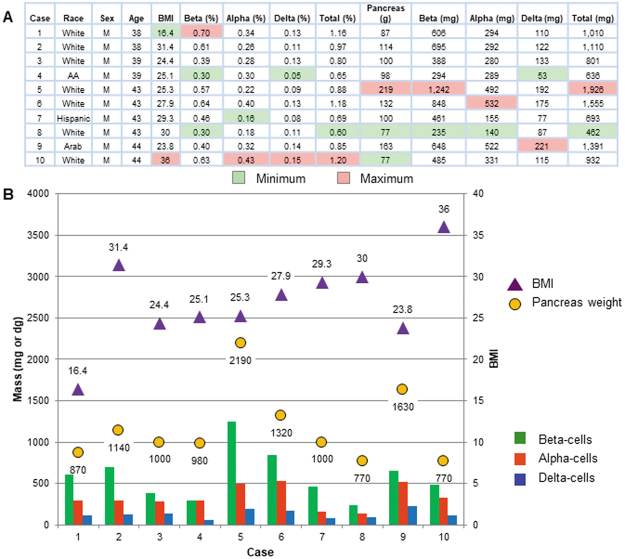
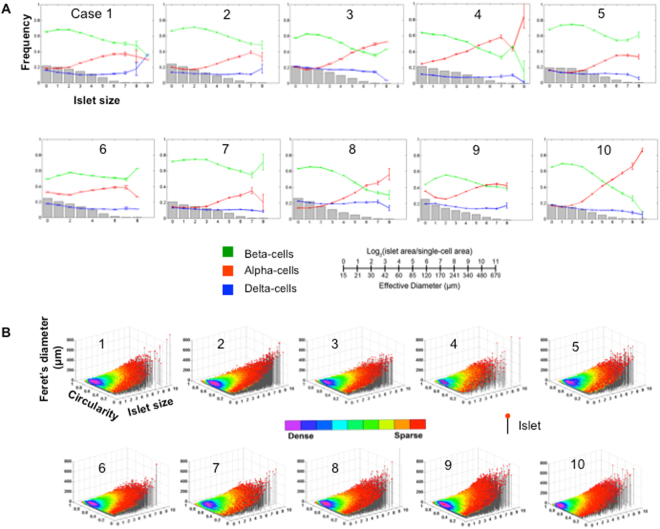
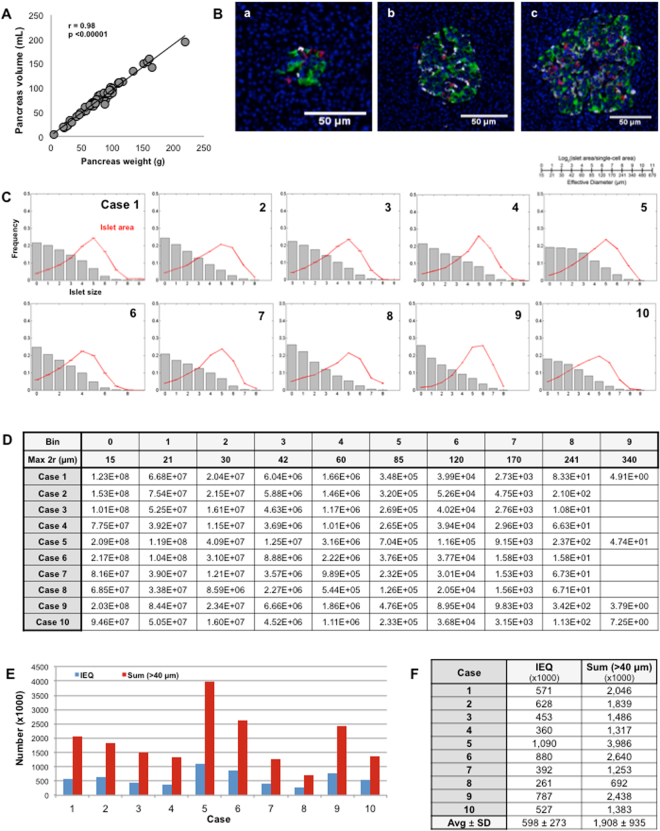
Pancreatic beta-cell mass is a critical determinant of the progression of diabetes. The loss of beta-cells in various types of diabetes has been documented in comparison to age, sex and body mass index (BMI) matched control subjects. However, the underlying heterogeneity of beta-cell mass in healthy individuals has not been considered. In this study, the inter-individual heterogeneity in beta-cell/islet mass was examined among 10 cases of age-matched non-diabetic male subjects in relation to BMI, pancreas weight, and the percent ratio, volume and number of islets in the whole pancreas. Beta-cell/islet mass was measured using a large-scale unbiased quantification method. In contrast to previous studies, we found no clinically relevant correlation between beta-cell/islet mass and age, BMI or pancreas weight, with large differences in beta-cell/islet mass and islet number among the individuals. Our method extracts the comprehensive information out of individual pancreas providing multifaceted parameters to study the intrinsic heterogeneity of the human pancreas.


Conflict of interest statement

The authors declare that they have no competing interests.

Figures

Figure 1
Figure 1
Whole pancreas analysis. Regional distribution of endocrine cells throughout the whole pancreas, beta-cells in green, alpha-cells in red and delta-cells in blue. Ten cases of age-matched non-diabetic male subjects are shown. X-axis: Block number from head, body to tail region (from left to right). All the graphs are plotted in the same scale for a better comparison. Each pancreas was divided into consecutive tissue blocks, with preparation alternating between fresh-frozen and paraffin embedding. The latter set of tissue blocks was used in the present study. The last bar in each plot depicts average ± SEM, which value is shown in the inset.
Figure 2
Figure 2
Heterogeneity of the human beta-cell/islet mass. (A) The ten cases examined for relationship between beta-cell/islet mass and BMI, pancreas weight, and the percent ratio and the volume of beta-, alpha- and delta-cells. The minimum and maximum values in each column are highlighted in light green and orange, respectively. (B) Summary of the results is shown as a compiled graph.
Figure 3
Figure 3
Islet size distribution, cellular composition. (A) Quantitative analysis of individual islet size distribution and cellular composition. Relative frequency of islet size (gray bar) and ratios of beta (green), alpha (red), and delta (blue) cells within islets are plotted against islet size; means ± SEM. Note that islet size is presented as a logarithmic scale considering the high number of small islets and the low number of large islets. In addition, islet area is divided by the single-cell area (178 μm2) to make them as dimensionless values representing the number of cells in a given islet area. See the conversion between logarithmic islet area (logarithmic) and effective diameter (μm). (B) 3D visualization of islet size and shape distribution. Each dot represents a single islet/cluster with reference to size (area) and shape. Circularity reports the degree of roundness of a structure, where 1.0 corresponds to a perfect circle. Feret’s diameter is the longest distance within a structure. Circularity and Feret’s diameter are closely related that together depict a shape of a given structure. The density of islets is color-coded from sparse to dense.
Figure 4
Figure 4
Assessment of the number of islets in the ten cases. (A) Pancreas tissue density. (B) Representative islets from small to large in size. (C) Fraction of islet size distribution (gray bar) and total islet area (red line). (D) The estimated number of islets in each bin. (E) Estimated number of IEQ (i.e. the unit of standardized islet mass used in clinical islet transplantation to assess the yield of isolated islets from donor pancreata) and islets with a diameter greater than 40 µm in the ten cases. (F) Summary of the islet numbers.

References

    1. Wang X, et al. Quantitative analysis of pancreatic polypeptide cell distribution in the human pancreas. PLoS. One. 2013;8:e55501. doi: 10.1371/journal.pone.0055501. - DOI - PMC - PubMed
    1. Wang X, et al. Regional differences in islet distribution in the human pancreas–preferential beta-cell loss in the head region in patients with type 2 diabetes. PLoS. One. 2013;8:e67454. doi: 10.1371/journal.pone.0067454. - DOI - PMC - PubMed
    1. Poudel A, Fowler JL, Zielinski MC, Kilimnik G, Hara M. Stereological analyses of the whole human pancreas. Sci. Rep. 2016;6:34049. doi: 10.1038/srep34049. - DOI - PMC - PubMed
    1. Wittingen J, Frey CF. Islet concentration in the head, body, tail and uncinate process of the pancreas. Ann. Surg. 1974;179:412–4. doi: 10.1097/00000658-197404000-00005. - DOI - PMC - PubMed
    1. Saito K, Yaginuma N, Takahashi T. Differential volumetry of A, B and D cells in the pancreatic islets of diabetic and nondiabetic subjects. Tohoku. J. Exp. Med. 1979;129:273–83. doi: 10.1620/tjem.129.273. - DOI - PubMed

Publication types

LinkOut - more resources