

Genotyping-by-Sequencing Derived High-Density Linkage Map and its Application to QTL Mapping of Flag Leaf Traits in Bread Wheat
- PMID: 29180623
- PMCID: PMC5703991
- DOI: 10.1038/s41598-017-16006-z
Genotyping-by-Sequencing Derived High-Density Linkage Map and its Application to QTL Mapping of Flag Leaf Traits in Bread Wheat
Abstract
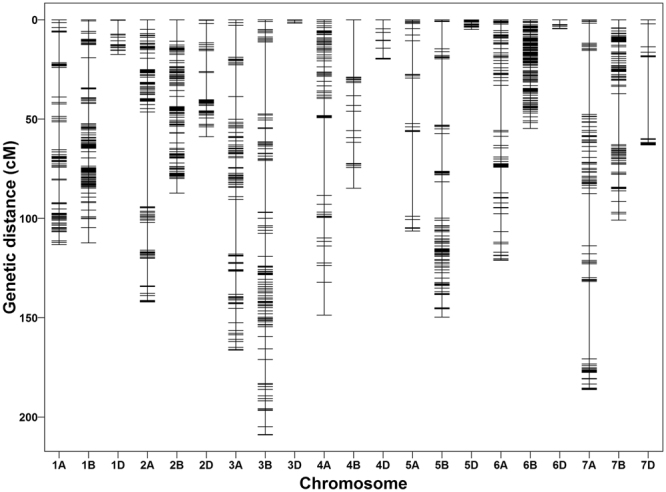
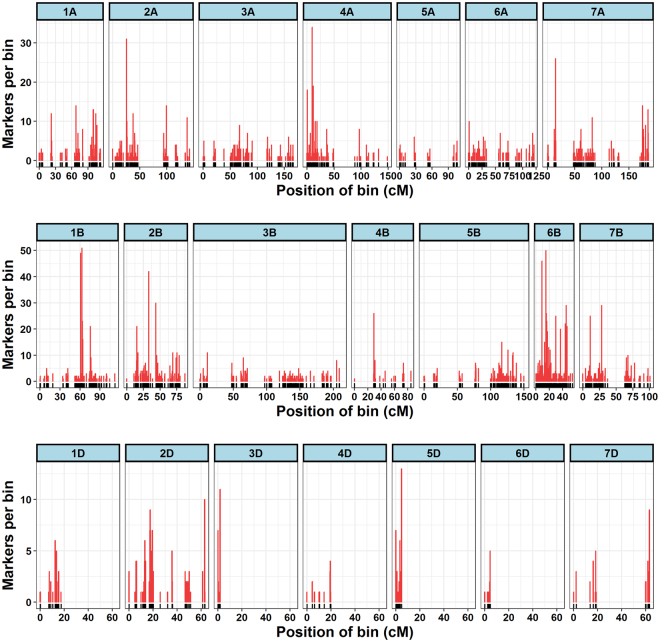
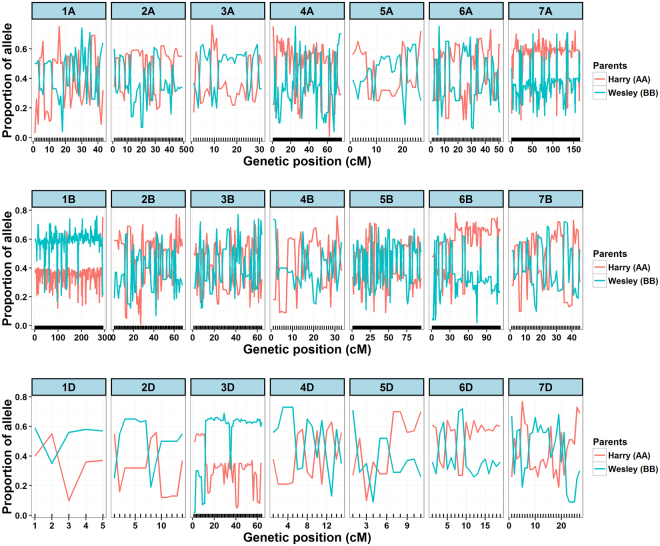
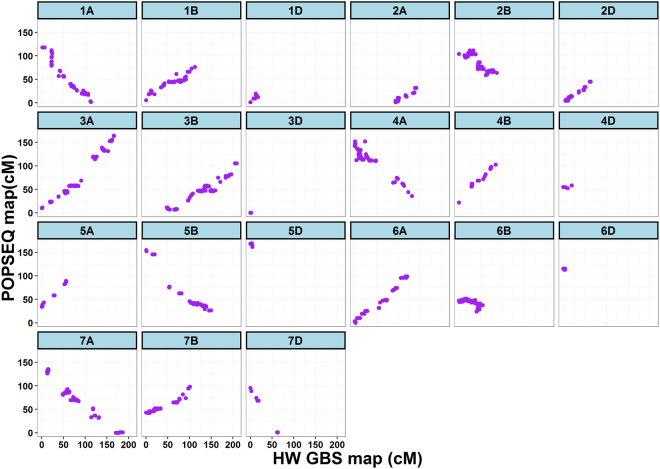
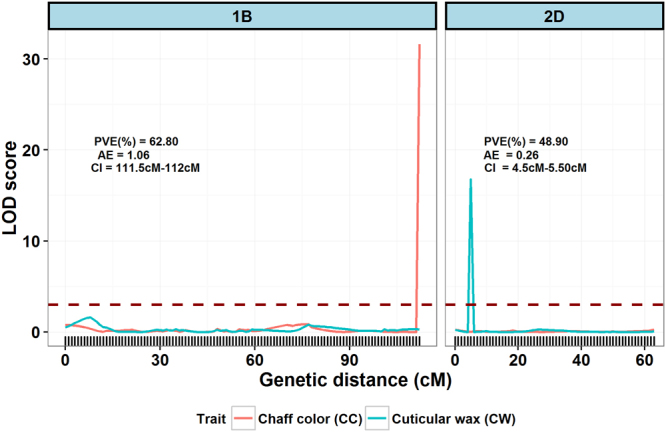
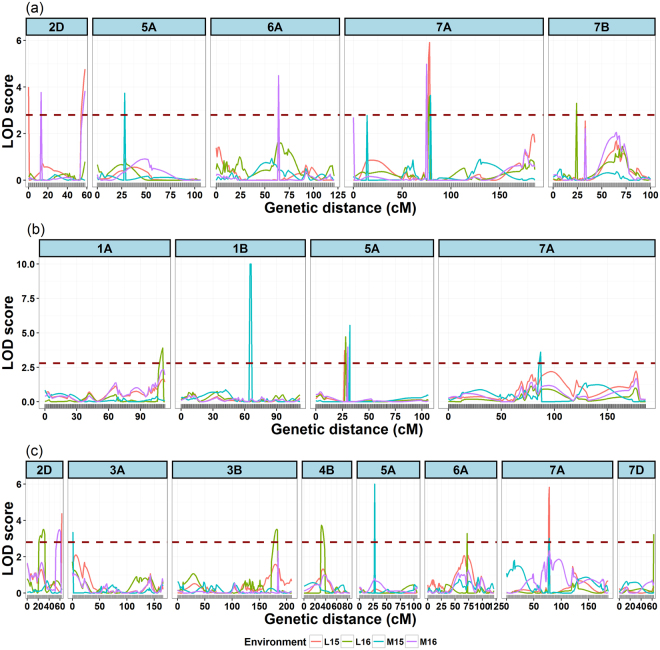
Winter wheat parents 'Harry' (drought tolerant) and 'Wesley' (drought susceptible) were used to develop a recombinant inbred population with future goals of identifying genomic regions associated with drought tolerance. To precisely map genomic regions, high-density linkage maps are a prerequisite. In this study genotyping-by- sequencing (GBS) was used to construct the high-density linkage map. The map contained 3,641 markers distributed on 21 chromosomes and spanned 1,959 cM with an average distance of 1.8 cM between markers. The constructed linkage map revealed strong collinearity in marker order across 21 chromosomes with POPSEQ-v2.0, which was based on a high-density linkage map. The reliability of the linkage map for QTL mapping was demonstrated by co-localizing the genes to previously mapped genomic regions for two highly heritable traits, chaff color, and leaf cuticular wax. Applicability of linkage map for QTL mapping of three quantitative traits, flag leaf length, width, and area, identified 21 QTLs in four environments, and QTL expression varied across the environments. Two major stable QTLs, one each for flag leaf length (Qfll.hww-7A) and flag leaf width (Qflw.hww-5A) were identified. The map constructed will facilitate QTL and fine mapping of quantitative traits, map-based cloning, comparative mapping, and in marker-assisted wheat breeding endeavors.
Conflict of interest statement
The authors declare that they have no competing interests.
Figures

Similar articles
-
High-density genetic linkage map construction and QTL mapping of grain shape and size in the wheat population Yanda1817 × Beinong6.PLoS One. 2015 Feb 12;10(2):e0118144. doi: 10.1371/journal.pone.0118144. eCollection 2015. PLoS One. 2015. PMID: 25675376 Free PMC article.
-
QTL mapping for flag leaf-related traits and genetic effect of QFLW-6A on flag leaf width using two related introgression line populations in wheat.PLoS One. 2020 Mar 19;15(3):e0229912. doi: 10.1371/journal.pone.0229912. eCollection 2020. PLoS One. 2020. PMID: 32191715 Free PMC article.
-
Genetic dissection of flag leaf morphology traits and fine mapping of a novel QTL (Qflw.sxau-6BL) in bread wheat (Triticum aestivum L.).Theor Appl Genet. 2025 Jan 8;138(1):21. doi: 10.1007/s00122-024-04802-x. Theor Appl Genet. 2025. PMID: 39777544
-
Fine mapping and gene cloning in the post-NGS era: advances and prospects.Theor Appl Genet. 2020 May;133(5):1791-1810. doi: 10.1007/s00122-020-03560-w. Epub 2020 Feb 10. Theor Appl Genet. 2020. PMID: 32040676 Free PMC article. Review.
-
Use of quantitative trait loci to map murine lung tumor susceptibility genes.Exp Lung Res. 1998 Jul-Aug;24(4):407-17. doi: 10.3109/01902149809087377. Exp Lung Res. 1998. PMID: 9659574 Review.
Cited by
-
Imputation accuracy of wheat genotyping-by-sequencing (GBS) data using barley and wheat genome references.PLoS One. 2019 Jan 7;14(1):e0208614. doi: 10.1371/journal.pone.0208614. eCollection 2019. PLoS One. 2019. PMID: 30615624 Free PMC article.
-
Linkage mapping and quantitative trait loci analysis of sweetness and other fruit quality traits in papaya.BMC Plant Biol. 2019 Oct 26;19(1):449. doi: 10.1186/s12870-019-2043-0. BMC Plant Biol. 2019. PMID: 31655544 Free PMC article.
-
QTL detection for bread wheat processing quality in a nested association mapping population of semi-wild and domesticated wheat varieties.BMC Plant Biol. 2022 Mar 21;22(1):129. doi: 10.1186/s12870-022-03523-x. BMC Plant Biol. 2022. PMID: 35313801 Free PMC article.
-
SSR Linkage Maps and Identification of QTL Controlling Morpho-Phenological Traits in Two Iranian Wheat RIL Populations.BioTech (Basel). 2022 Aug 8;11(3):32. doi: 10.3390/biotech11030032. BioTech (Basel). 2022. PMID: 35997340 Free PMC article.
-
Identification of quantitative trait loci associated with nitrogen use efficiency in winter wheat.PLoS One. 2020 Feb 24;15(2):e0228775. doi: 10.1371/journal.pone.0228775. eCollection 2020. PLoS One. 2020. PMID: 32092066 Free PMC article.
References
Publication types
MeSH terms
LinkOut - more resources
Full Text Sources
Other Literature Sources
