. 2017 Nov 27;7(1):16386.
doi: 10.1038/s41598-017-15575-3.

Alpha-synuclein facilitates to form short unconventional microtubules that have a unique function in the axonal transport

Affiliations

Alpha-synuclein facilitates to form short unconventional microtubules that have a unique function in the axonal transport

Shiori Toba et al. Sci Rep. .

Erratum in

Abstract

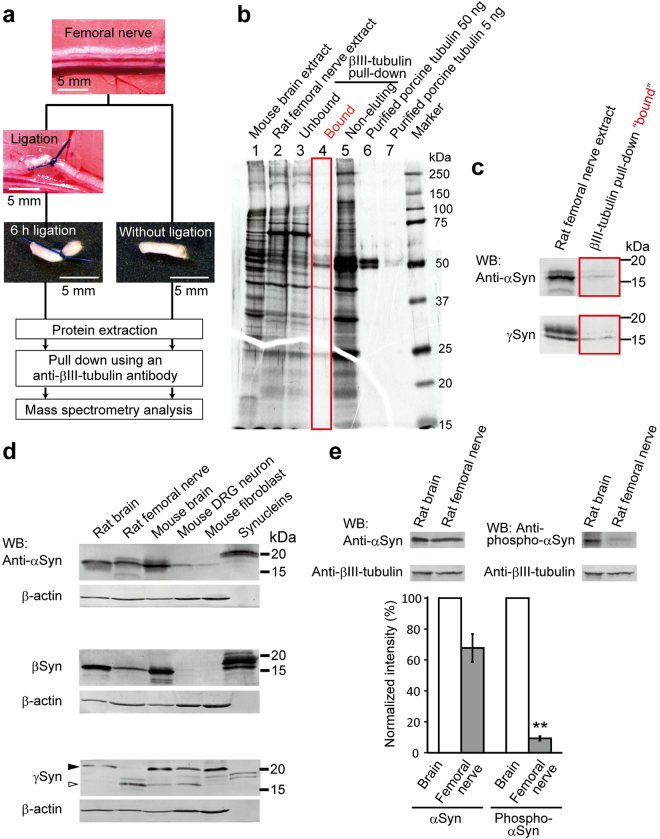
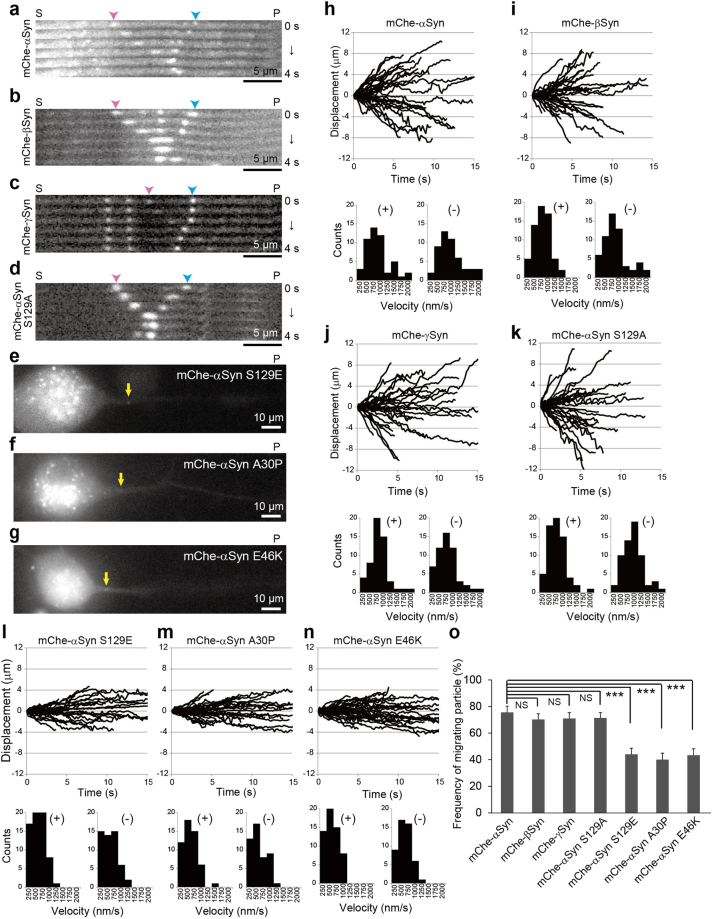
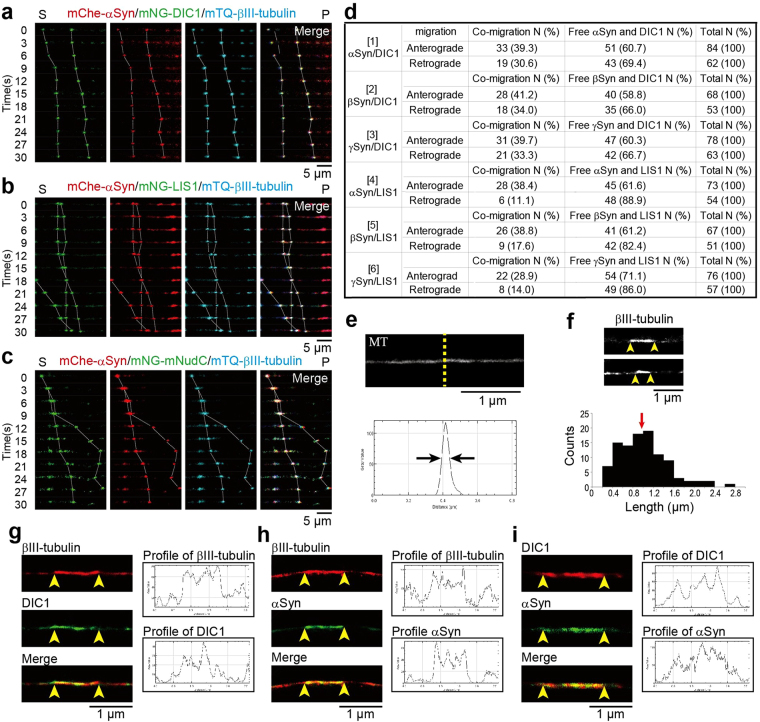
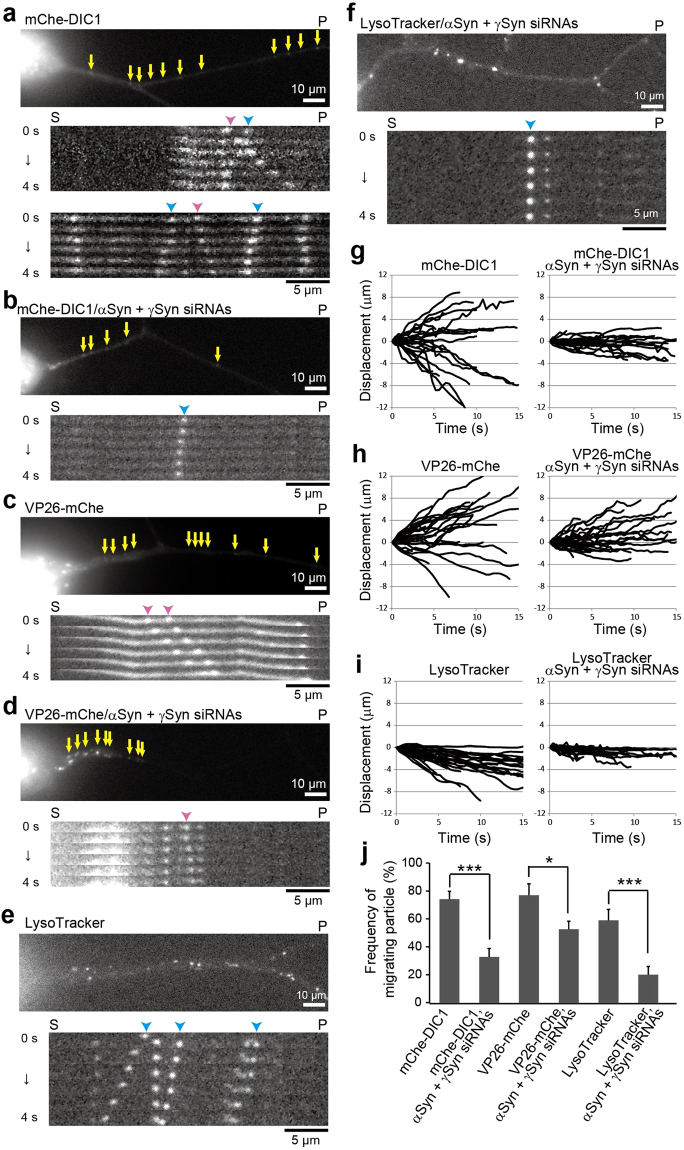
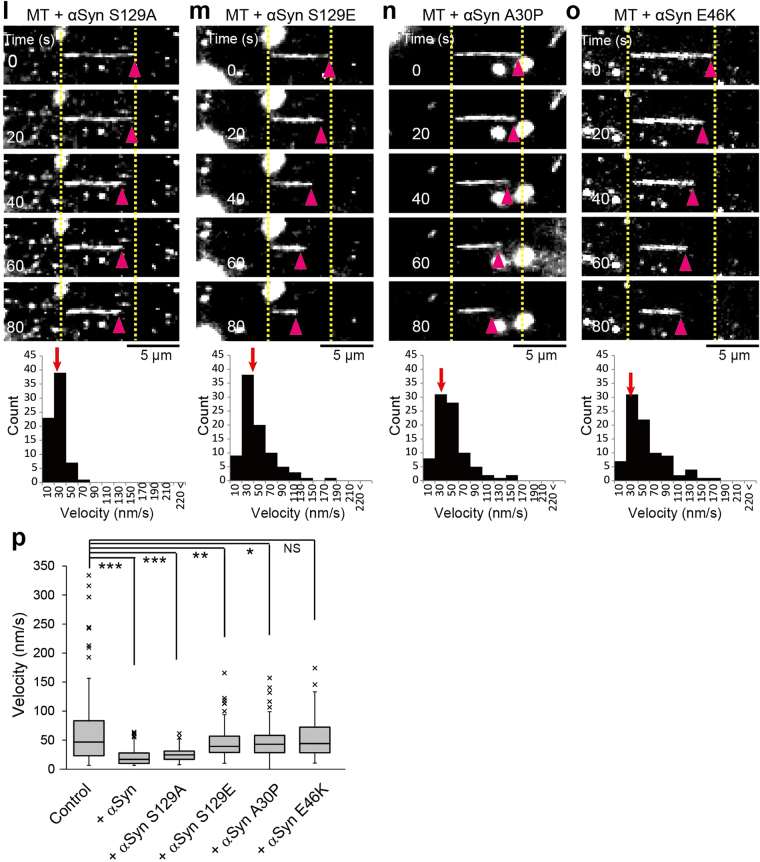
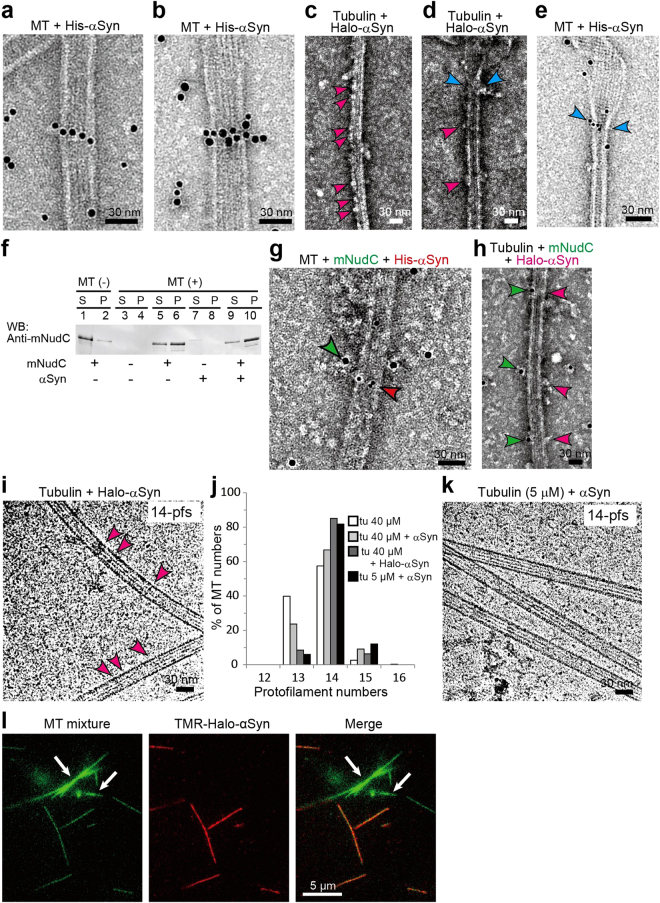
Although α-synuclein (αSyn) has been linked to Parkinson's disease (PD), the mechanisms underlying the causative role in PD remain unclear. We previously proposed a model for a transportable microtubule (tMT), in which dynein is anchored to a short tMT by LIS1 followed by the kinesin-dependent anterograde transport; however the mechanisms that produce tMTs have not been determined. Our in vitro investigations of microtubule (MT) dynamics revealed that αSyn facilitates the formation of short MTs and preferentially binds to MTs carrying 14 protofilaments (pfs). Live-cell imaging showed that αSyn co-transported with dynein and mobile βIII-tubulin fragments in the anterograde transport. Furthermore, bi-directional axonal transports are severely affected in αSyn and γSyn depleted dorsal root ganglion neurons. SR-PALM analyses further revealed the fibrous co-localization of αSyn, dynein and βIII-tubulin in axons. More importantly, 14-pfs MTs have been found in rat femoral nerve tissue, and they increased approximately 19 fold the control in quantify upon nerve ligation, indicating the unconventional MTs are mobile. Our findings indicate that αSyn facilitates to form short, mobile tMTs that play an important role in the axonal transport. This unexpected and intriguing discovery related to axonal transport provides new insight on the pathogenesis of PD.


Conflict of interest statement

The authors declare that they have no competing interests.

Figures

Figure 1
Figure 1
αSyn and γSyn interact with βIII-tubulin in rat femoral nerves. (a) Schematic illustration of protein extraction from the rat femoral nerve. Under anesthesia, both sides of the rat femoral nerve roots were ligated to promote the accumulation of transported components at the ligated terminal. After 6 h of ligation, soluble proteins were extracted and subjected to a pull-down assay using an anti-βIII-tubulin antibody. After elution, the components were analyzed by LC-MS/MS. Scale bar: 5 mm. (b) Overview of silver staining with femoral nerve extraction. The eluted co-precipitates are indicated by the red square (lane 4). (c) Examination of co-precipitates by Western blotting (WB). According to the βIII-tubulin interactome obtained by LC-MS/MS analysis (Supplementary Fig. S1a), the co-precipitates were examined with anti-αSyn (upper) and anti-γSyn (lower) antibodies. (d) Expression profile of the three synucleins (Syns) examined in rat and mouse as indicated at the top. The filled arrowhead in the γSyn detection panel indicates phosphorylated γSyn, and the open arrowhead indicates unphosphorylated γSyn. Recombinant αSyn, βSyn and γSyn were loaded in the right-hand lane in each panel. β-actin was used as a loading control. (e) Phosphorylated αSyn in rat brain and femoral nerve. The expression of αSyn and phosphorylated αSyn was probed with anti-αSyn and anti-phospho-S129-αSyn antibodies, respectively. βIII-tubulin was used as a loading control. Quantification of the phosphorylation observed in 3 independent sets of experiments is shown in the lower panel. The signal intensity of αSyn or phospho-αSyn in brain was set at 100%. Data are presented as the mean ± SEM. **P < 0.01 by Student’s t-test. See also Supplementary Fig. S1.
Figure 2
Figure 2
Transport behavior of mCherry-tagged Syns in DRG neurons. (ad) mCherry-tagged Syns were expressed in DRG neurons using lentivirus vectors and examined using live-cell imaging. The kymographs depict moving particles of mCherry-αSyn (a), mCherry-βSyn (b), mCherry-γSyn (c), and mCherry-αSyn S129A (d) along axons. Pink and blue arrowheads indicate anterograde and retrograde movements, respectively. The elapsed time is shown at the right. (eg) Abnormal accumulation of three mutated αSyns in the DRG soma. Lentivirus vector-mediated expression of mCherry-αSyn S129E (e), mCherry-αSyn A30P (f), and mCherry-αSyn E46K (g) was observed, and all three mutated αSyns were found to aberrantly accumulate in the soma. The yellow arrows indicate punctate intensity in the images showing the disrupted movement of the αSyn mutated forms. In (ag), ‘S’ and ‘P’ indicate the directions of the neuronal soma and its peripheral region, respectively. Scale bars: 5 μm in (ad) and 10 μm in (eg). (hn) Analyzed trajectories of mCherry-tagged Syns as indicated at the upper areas of the panels. Anterograde and retrograde displacements are shown as positive and negative values, respectively (N = 30 particles in each graph). The distribution of velocities is shown beneath each trajectory (N = 60 particles). “ + ” and “−” in each graph indicate anterograde and retrograde movement, respectively. (o) Frequencies of moving particles as indicated on the transverse axis (N = 60 in each target). Particles with velocities > 500 nm/s were defined as moving. P values were calculated with t-test. ***p < 0.001, mean ± SEM; NS indicates not significant. See also Supplementary Videos 1–2.
Figure 3
Figure 3
Triple- and dual-color imaging showing the co-migration of αSyn with mobile MTs. (ac) Direct visualization of the anterograde movement of fluorescently tagged proteins in DRG neurons using triple-color live-cell imaging. The co-migration of mNG-DIC1, mChe-αSyn and mTQ-βIII-tubulin (a), mNG-LIS1, mChe-αSyn and mTQ-βIII-tubulin (b), and mNG-mNudC, mChe-αSyn and mTQ-βIII-tubulin (c) was observed using confocal time-lapse microscopy. The dotted lines indicate dynamic co-migration of the three types of particles as indicated in each image set. ‘S’ and ‘P’ indicate the directions of the neuronal soma and its peripheral region, respectively. Scale bar: 5 μm. (d) Anterograde and retrograde co-migration frequencies in DRG neurons. Co-migration (left), independent migration (middle), and total number of examined signals (right) are indicated. (e) Super-resolution photoactivated localization microscopy (SR-PALM) image of MTs. The intensity distribution profile across a MT at the area indicated by the yellow dotted line is shown in the graph. The width at the half-value of the peak approaches ~50 nm (indicated by the black arrows). (f) Short MT fragments detected along axons. The ends of the fragments are indicated by yellow arrowheads. The measured length of the MT fragments are shown beneath the image. The median length is 1 μm (red arrow). (gi) Co-localization of DIC1 and αSyn with βIII-tubulin detected by dual-color SR-PALM. Co-localization of cage 590-labeled βIII-tubulin with cage 500-labeled DIC1 (g), cage 590-labeled βIII-tubulin with cage 500-labeled αSyn (h), and cage 590-labeled DIC1 with cage 500-labeled αSyn (i) were examined. The intensity profiles are shown at the right side of each panel. Scale bar: 1 μm in (ei). See also Supplementary Fig. S4 and Supplementary Video 4.
Figure 4
Figure 4
Effect of αSyn and γSyn on axonal transport. (af) Axonal transport visualized using mCherry-DIC1, VP26-mCherry and LysoTracker. The behavior of mCherry-DIC1 (a,b), VP26-mCherry (c,d) and LysoTracker (e,f) in the axon was observed with (b,d and f) or without (a,c and e) treatment of αSyn and γSyn siRNAs. Representative kymographs are shown beneath each image, and the elapsed time is shown on the left. mCherry-DIC1 was expressed using the lentivirus infection system, and VP26-mCherry and all siRNAs were introduced using the Neon transfection system. The pink and blue arrowheads indicate dynamic anterograde and retrograde movement, respectively. “S”, soma; “P”, peripheral region. Scale bars: 10 μm in DRG images and 5 μm in kymographs. (gi) Summarized trajectories of target particles as indicated. Thirty particles were traced in each case. Positive values indicate anterograde displacement, and negative values indicate retrograde displacement. (j) Statistically quantified frequencies of moving particles. Particles moving at > 500 nm/s were quantified (N = 60 for each target). P values were calculated with t-test, mean ± SEM; *p < 0.05, ***p < 0.001. See also Supplementary Video 5.
Figure 5
Figure 5
Effect of Syns on tubulin polymerization and depolymerization. (ah) MTs undergoing polymerization with unlabeled tubulin in vitro were visualized using dark-field light microscopy. Tubulin polymerization was performed without Syns (a) and with αSyn (b), βSyn (c), γSyn (d), αSyn S129A (e), αSyn S129E (f), αSyn A30P (g), or αSyn E46K (h). MT length with or without Syns was measured and is shown beneath each image. The median values are indicated by red arrows. Scale bar: 30 μm. (i) Box-and-whisker plots of the lengths of MTs polymerized in vitro (N = 100 for each condition). (jo) Effect of αSyns on MT stabilization. Unilaterally occurring spontaneous depolymerization was measured in vitro without αSyns (j) and with αSyn (k), αSyn S129A (l), αSyn S129E (m), αSyn A30P (n), or αSyn E46K (o). The distributions of the depolymerization velocities are shown beneath each image set. Spontaneous depolymerization proceeded unilaterally in each case. The pink arrowheads indicate the tips of depolymerizing MTs, and the dotted yellow lines indicate the original lengths of the MTs. The median values are indicated by red arrows. Scale bar: 5 μm. (p) Box-and-whisker plots of the spontaneous depolymerization velocities (N = 80 in each condition). P values in (i) and (p) were calculated with t-test of nonparametric test, mean ± SEM; ***p < 0.001, **p < 0.01, *p < 0.05, “NS” means not significant. See also Supplementary Videos 6 and 7.
Figure 6
Figure 6
Characterization of αSyn binding to MTs using colloidal gold particles and Halo-tags. (a,b) αSyn binding to MTs was analyzed by transmission electron microscope (TEM). MTs were mixed with colloidal gold-labeled αSyn (Gold-αSyn) and negatively stained with 2% of uranyl acetate. Gold-αSyn was prepared from N-terminal His-tagged αSyn (His-αSyn). Gold-αSyns appeared as string-like αSyn polymers on MTs. (c) TEM image of MT polymerized with Halo-tagged αSyn (Halo-αSyn). Bamboo joint-like structures (indicated by magenta arrowheads) are visible on the MTs. (d) MT end structure with Halo-αSyn. Joint-like structures similar to those shown in (c) are indicated by magenta arrowheads. Halo-αSyns were also observed in the zone between the outwardly opened tubulin sheet and MT cylinder (blue arrowheads). (e) Gold-αSyn located at the transition zone (blue arrowheads). (f) MT pull-down assay. mNudC co-precipitated with MTs was examined in the absence and presence of αSyn. (g) Dual labeling immunoelectron microscopy (IEM) used to visualize the interaction of MT with mNudC and αSyn. mNudC was labeled with 10 nm colloidal gold (green) via anti-mNudC antibody; and His-αSyn was labeled with 5 nm colloidal gold (red). Co-localization of mNudC and αSyn on a MT is indicated by arrowheads. (h) MT polymerized with Halo-αSyn (magenta) and Gold-mNudC (green). Bamboo joint-like structures (magenta) and colloidal gold (green) indicate co-localization of mNudC with Halo-αSyn on a MT. (i) Cryo-TEM image of MTs polymerized with Halo-αSyn. Joint-like structures on MTs are indicated by magenta arrowheads. MT pfs numbers determined from Moiré patterns are indicated at the top right. (j) Distribution of the pfs numbers of polymerized MTs. The MTs assembled from 40 μM of tubulin (tu) without paclitaxel stabilization mainly formed 13- and 14-pfs MTs (for tu 40 μM, N = 261). The addition of αSyn clearly increased the number of MTs carrying 14-pfs even at 5 μM tubulin (tu 40 μM + αSyn, N = 259; tu 40 μM + Halo-αSyn, N = 135; tu 5 μM + αSyn, N = 111). (k) Cryo-TEM image of MTs polymerized with αSyn and 5 μM of tubulin. MT pfs numbers determined from Moiré patterns are indicated at the top right. Bar: 30 nm. (l) Selective binding of αSyn to MTs. A mixture of axoneme-nucleated MTs (axoneme-MTs) and GMPCPP polymerized MTs (GMPCPP-MTs) was incubated with TMR-Halo-αSyn (red) in a chamber. The white arrows indicate axoneme-MTs; narrow MTs correspond to GMPCPP-MTs. TMR-Halo-αSyn appears to preferentially bind to GMPCPP-MTs, but not to axoneme-MTs. Scale bar: 30 nm in (ae), (gi) and (k); and 5 μm in (l).
Figure 7
Figure 7
Unconventional MTs carrying 14-pfs in rat femoral nerves. Rat femoral nerves with or without ligation were embedded into resin block and examined by TEM. (a) Overview of a micrograph with conventional MTs carrying 13-pfs. The rectangle surrounded area was enlarged and shown in (d). (b) Overview of a micrograph showing unconventional MTs containing 14-pfs. The rectangle surrounded area was enlarged and shown in (e). (c) Overview image of the ligated femoral nerve. Unconventional MTs were captured in ligated nerve, and the rectangle surrounded area was enlarged and shown in (f). (g) Comparison of unconventional MTs in unligated and ligated femoral nerves. The percentage of MTs with 14-pfs in the unligated femoral nerve is 0.5% (10 of 2016 MTs), in the ligated nerve is 8.8% (22 of 230 MTs). (h) Localization of αSyn in femoral nerves visualized by IEM. Silver-enhanced gold particles are observed surrounding fuzzy material around MTs with 14-pfs (right panel), but are not visible in MTs with 13-pfs (left panel). (i) Model for the tMT in the anterograde transport of cytoplasmic dynein by kinesin-1. LIS1 anchors cytoplasmic dynein to a Syn-stabilized tMT followed by the tethering to a kinesin molecule under mNudC mediation. Scale bar: 50 nm in (ac); and 25 nm in (h).

Similar articles

Cited by

References

    1. Desai A, Mitchison TJ. Microtubule polymerization dynamics. Annu Rev Cell Dev Biol. 1997;13:83–117. doi: 10.1146/annurev.cellbio.13.1.83. - DOI - PubMed
    1. Mitchison, T., Evans, L., Schulze, E. & Kirschner, M. Sites of microtubule assembly and disassembly in the mitotic spindle. Cell45, 515–527, doi:10.1016 (1986). - PubMed
    1. Kirschner MW, Mitchison T. Microtubule dynamics. Nature. 1986;324:621. doi: 10.1038/324621a0. - DOI - PubMed
    1. Ray S, Meyhofer E, Milligan RA, Howard J. Kinesin follows the microtubule’s protofilament axis. The Journal of cell biology. 1993;121:1083–1093. doi: 10.1083/jcb.121.5.1083. - DOI - PMC - PubMed
    1. Wade RH, Chretien D. Cryoelectron microscopy of microtubules. J Struct Biol. 1993;110:1–27. doi: 10.1006/jsbi.1993.1001. - DOI - PubMed

Publication types

MeSH terms