Clinical Trial
. 2017 Nov 28;8(1):1816.
doi: 10.1038/s41467-017-01968-5.

Integrating evolutionary dynamics into treatment of metastatic castrate-resistant prostate cancer

Affiliations
Clinical Trial

Integrating evolutionary dynamics into treatment of metastatic castrate-resistant prostate cancer

Jingsong Zhang et al. Nat Commun. .

Abstract

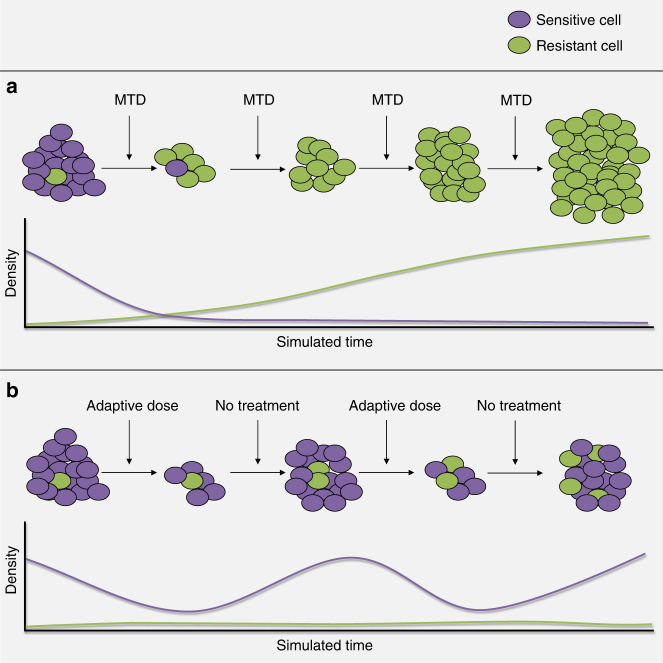
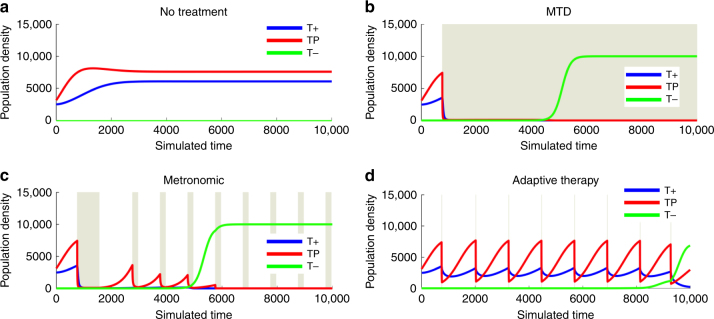
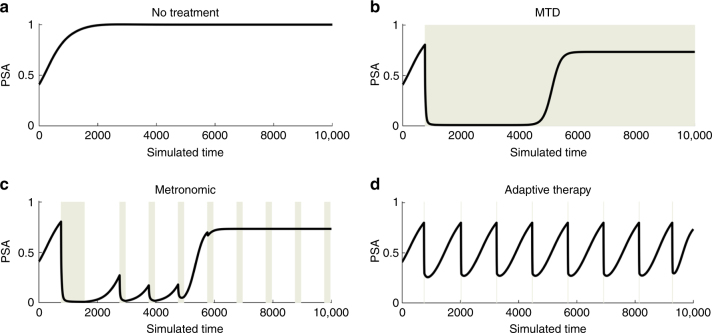
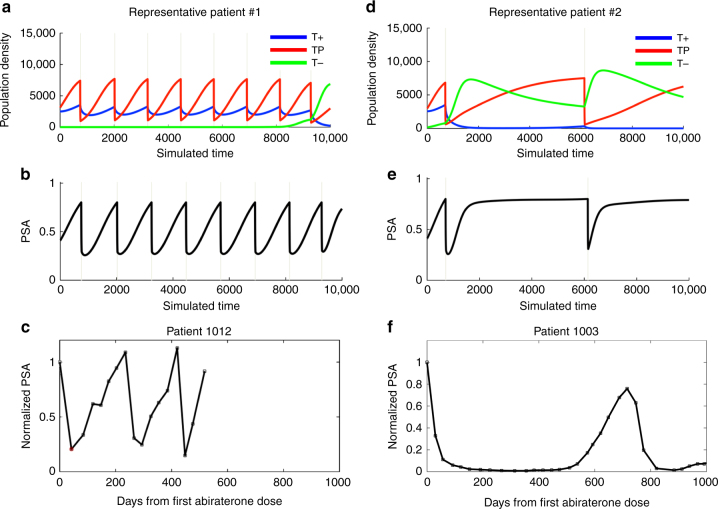
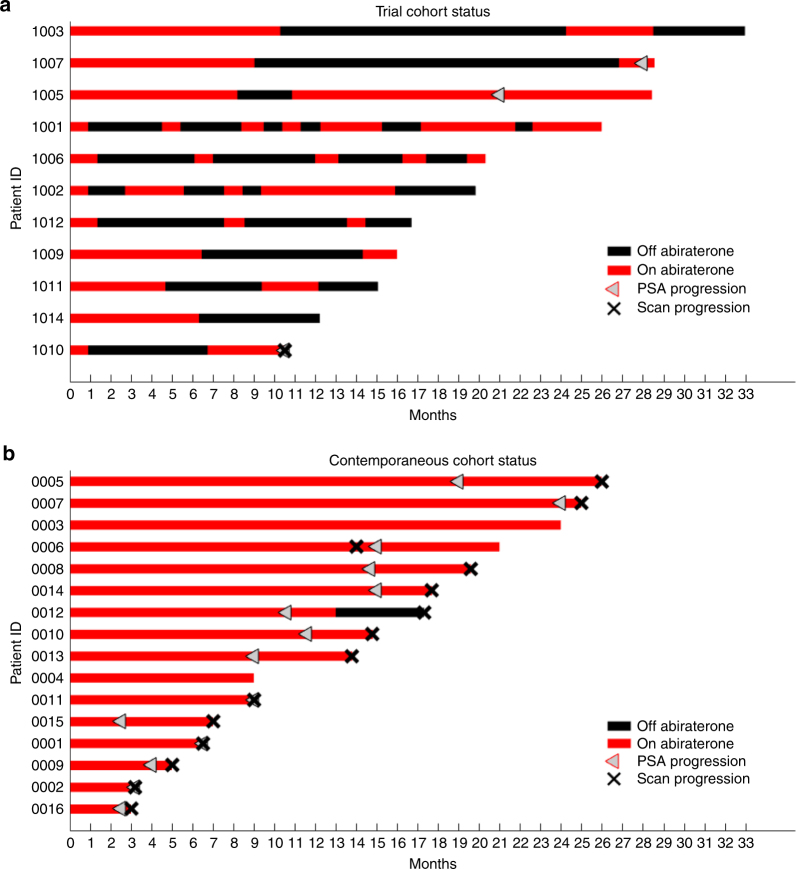
Abiraterone treats metastatic castrate-resistant prostate cancer by inhibiting CYP17A, an enzyme for testosterone auto-production. With standard dosing, evolution of resistance with treatment failure (radiographic progression) occurs at a median of ~16.5 months. We hypothesize time to progression (TTP) could be increased by integrating evolutionary dynamics into therapy. We developed an evolutionary game theory model using Lotka-Volterra equations with three competing cancer "species": androgen dependent, androgen producing, and androgen independent. Simulations with standard abiraterone dosing demonstrate strong selection for androgen-independent cells and rapid treatment failure. Adaptive therapy, using patient-specific tumor dynamics to inform on/off treatment cycles, suppresses proliferation of androgen-independent cells and lowers cumulative drug dose. In a pilot clinical trial, 10 of 11 patients maintained stable oscillations of tumor burdens; median TTP is at least 27 months with reduced cumulative drug use of 47% of standard dosing. The outcomes show significant improvement over published studies and a contemporaneous population.

Trial registration: ClinicalTrials.gov NCT02415621.


Conflict of interest statement

The authors declare no competing financial interests.

Figures

Fig. 1
Fig. 1
Illustration of the designed evolutionary dynamics in adaptive therapy. a,b The purple cells are sensitive to the treatment and the green cells are resistant.  The graphs represent the simulated density of each population over time during treatment. The top row represents standard therapy in which  the maximum tolerated dose is given continuously after initiation. The cells sensitive to treatment are eliminated quickly. This  intensely selects for cells that are resistant to the treatment, in this case T− cells, and eliminates the competition effects of the T+ population, resulting in competitive release with rapid  treatment failure and tumor progression. The bottom row represents an  evolution-based strategy in which therapy is halted before all of the sensitive cells  are eliminated. In the absence of therapy, the sensitive cells out-compete the resistant cells due to their fitness advantage. This “steers” the tumor back to the pretreatment so that it remains sensitive to treatment. The resistant cells, or T− population, will increase slightly with each cycle so that this treatment eventually fails. However, mathematical models demonstrate control may be durably maintained for up to 20 cycles - significantly longer than continuous therapy.
Fig. 2
Fig. 2
Simulation results. Computer simulations of mCRPC growth during conventional maximum tolerated dose, metronomic, and adaptive application of abiraterone where the gray background indicates administration of abiraterone in Patient #1. a shows underlying population dynamics of a tumor if left untreated. b shows continuous application of abiraterone resulting in competitive release of T− cells and tumor progression. c panel shows a metronomic therapy similar to ADT intermittent therapy study where the lengthy induction period and further abiraterone is given at predetermined intervals. This shows that the benefit gained from adaptive therapies is not just the decrease in drug dosage but is indeed the evolutionary guided timing of the cycles. d shows a short administration of abiraterone decreasing the TP and T+ cells. However, abiraterone is discontinued when the PSA falls below 50% of the pretreatment value (Fig. 3). This permits recovery of TP and T+ cells, reverses the increase in T− cells, and prevents competitive release. After each treatment cycle, the tumor subpopulations remain nearly identical in size and composition
Fig. 3
Fig. 3
Computer simulations of PSA under varying treatment conditions. The gray background indicates administration of abiraterone in Patient #1. a demonstrates the PSA dynamics if no treatment was administered. b shows the classic PSA dynamics of maximal tolerated dose MTD, where a large response is maintained until PSA progression. c show the PSA dynamics for a metronomic therapy where treatment is not synchronized to patient-specific PSA dynamics. d shows the PSA dynamics of the clinical trial protocol, where PSA decreases to 50% of the baseline PSA and is allowed to return back to baseline before another dose of abiraterone is given
Fig. 4
Fig. 4
a,b,d, and e show computer simulations demonstrating variation in cycle length. Time between treatments  is shown to vary based on the competition coefficients of the matrix and the resulting prevalance of T+ cells. Panels a and b show Patient #1’s fast cycling dynamics as the large T+ population contributes to the PSA reaching the treatment PSA level quickly. The durable control of T− cells is provided by the TP cell population. Alternately, panels d and e Patient #2 shows a low density of T+ cells resulting in long cycles. The variation in patient cycling rates explains the limitation of intermittent therapies administered without synchronization with underlyling evolutionary dynamics. Panels c and f  show actual PSA fluctuations in two of the clinical trial patients with associated abiraterone administration. The first dose of abiraterone is given at day 0. In each case, the PSA is normalized to its value on day 0. The drug is withdrawn when the PSA falls below 50% of the original value. It is withheld until the PSA returns to its initial value (corresponding to the PSA peaks). This explicit incorporation  of  Darwinian principles into treatment  allows drug administration to synchronise with patient-specific  intratumoral evolutionary dynamics
Fig. 5
Fig. 5
A summary of the status of the 11 patients in the pilot trial (a) and 16 patients in the contemporaneous cohort (b). In the SOC group, 14 of 16 have progressed radiographically compared to 1 of 11 in the adaptive therapy cohort. Cumulative dose of abiraterone in the adaptive therapy patients was 47% of SOC

Comment in

References

    1. Aktipis CA, Kwan VS, Johnson KA, Neuberg SL, Maley CC. Overlooking evolution: a systematic analysis of cancer relapse and therapeutic resistance research. PLoS ONE. 2011;6:e26100. doi: 10.1371/journal.pone.0026100. - DOI - PMC - PubMed
    1. Enriquez-Navas PM, Wojtkowiak JW, Gatenby RA. Application of evolutionary principles to cancer therapy. Cancer Res. 2015;75:4675–4680. doi: 10.1158/0008-5472.CAN-15-1337. - DOI - PMC - PubMed
    1. Gatenby RA, Silva AS, Gillies RJ, Frieden BR. Adaptive therapy. Cancer Res. 2009;69:4894–4903. doi: 10.1158/0008-5472.CAN-08-3658. - DOI - PMC - PubMed
    1. Gatenby RA, Brown J, Vincent T. Lessons from applied ecology: cancer control using an evolutionary double bind. Cancer Res. 2009;69:7499–7502. doi: 10.1158/0008-5472.CAN-09-1354. - DOI - PubMed
    1. Gatenby RA. A change of strategy in the war on cancer. Nature. 2009;459:508–509. doi: 10.1038/459508a. - DOI - PubMed

Publication types

Associated data