. 2017 Nov 27;7(1):16365.
doi: 10.1038/s41598-017-16555-3.

FAD104, a regulator of adipogenesis, is a novel suppressor of TGF-β-mediated EMT in cervical cancer cells

Affiliations

FAD104, a regulator of adipogenesis, is a novel suppressor of TGF-β-mediated EMT in cervical cancer cells

Motoharu Goto et al. Sci Rep. .

Abstract

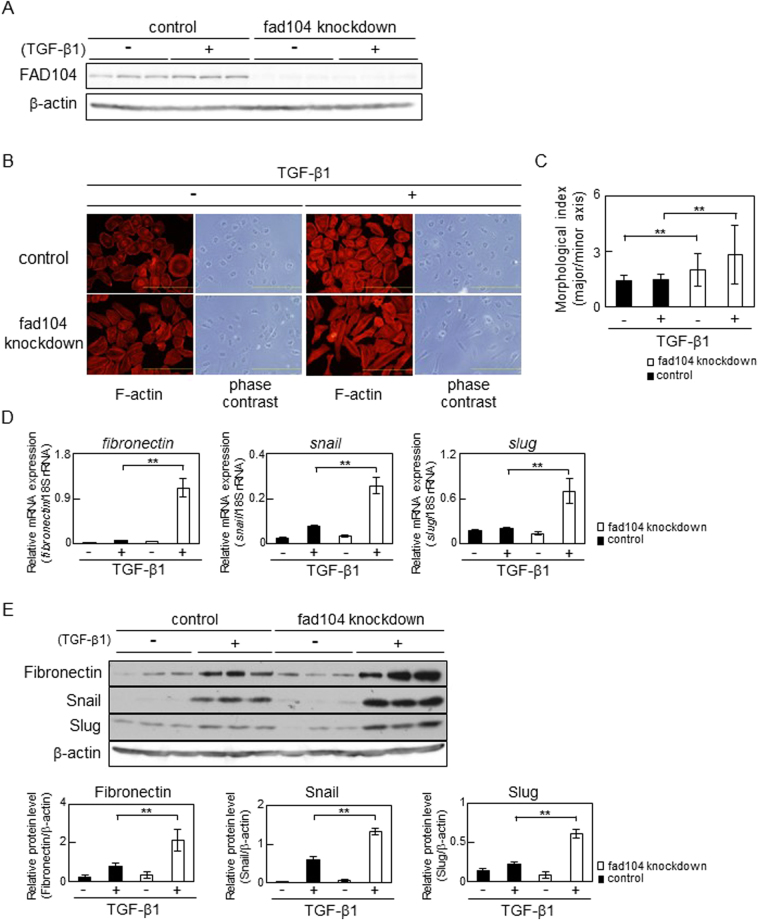
Epithelial-to-mesenchymal transition (EMT) is a biological process in which epithelial cells translate into a mesenchymal phenotype with invasive capacities, contributing to tumour progression, metastasis, and the acquisition of chemotherapy resistance. To identify new therapeutic targets for cancers, it is important to clarify the molecular mechanism of induction of EMT. We have previously reported that fad104, a positive regulator of adipocyte differentiation, suppressed the invasion and metastasis of melanoma and breast cancer cells. In this study, we showed that FAD104 functions as a novel suppressor of transforming growth factor-β (TGF-β)-mediated EMT in cervical cancer cells. Expression of FAD104 is upregulated during TGF-β-mediated EMT in human cervical cancer HeLa cells. Reduction of fad104 expression enhanced TGF-β-mediated EMT and migration in HeLa cells. Conversely, overexpression of FAD104 suppressed TGF-β-induced EMT. In addition, we showed that FAD104 negatively regulated phosphorylation of Smad2 and Smad3 but positively regulated phosphorylation of Smad1/5/8 via treatment with TGF-β. These findings demonstrate that FAD104 is a novel suppressor of TGF-β signalling and represses TGF-β-mediated EMT in cervical cancer cells.


Conflict of interest statement

The authors declare that they have no competing interests.

Figures

Figure 1
Figure 1
FAD104 expression is elevated during TGF-β–mediated EMT in HeLa cells. HeLa cells were treated with 5 ng/mL TGF-β1 or vehicle for 72 h. (A) Morphological changes of HeLa cells after treatment with TGF-β1. F-actin was visualized by TRITC-conjugated phalloidin. (B) The expression of the epithelial marker ZO-1 and mesenchymal marker Fibronectin after treatment with TGF-β1. Whole-cell lysates were subjected to Western blot analysis and β-actin was used as a loading control. (C) qPCR analysis of fad104 expression in HeLa cells treated with TGF-β1. The expression level of fad104 was normalized with 18 S rRNA expression. Each column represents the mean with standard deviation (n = 3). Significant differences are indicated as **p < 0.01. (D) Protein expression of FAD104 in HeLa cells after treatment with TGF-β1. Whole-cell lysates were subjected to Western blot analysis and β-actin was used as a loading control.
Figure 2
Figure 2
FAD104 expression is elevated during TGF-β–mediated EMT in NMuMG cells. NMuMG cells were treated with 5 ng/mL TGF-β1 or vehicle for 48 h. (A) Morphological changes in NMuMG cells after treatment with TGF-β1. F-actin was visualized by TRITC-conjugated phalloidin. (B) Expression of the epithelial marker ZO-1 and mesenchymal marker N-cadherin after treatment with TGF-β1. Whole-cell lysates were subjected to Western blot analysis and β-actin was used as a loading control. (C) qPCR analysis of fad104 expression in NMuMG cells treated with TGF-β1. The expression level of fad104 was normalized with 18 S rRNA expression. Each column represents the mean with standard deviation (n = 3). Significant differences are indicated as **p < 0.01. (D) Protein expression of FAD104 in NMuMG cells after treatment with TGF-β1. Whole-cell lysates were subjected to Western blot analysis and β-was used as a loading control.
Figure 3
Figure 3
Fad104 knockdown enhances TGF-β–mediated EMT in HeLa cells. (A) Knockdown efficiency of fad104 in HeLa cells. HeLa cells were transfected with siRNA targeting fad104 (sifad104-A) and treated with 5 ng/mL TGF-β1. Luciferase siRNA was used as a control. β-Actin expression was used as a loading control. (B) Morphological changes in HeLa cells transfected with fad104 siRNA. Cells were treated with 5 ng/mL TGF-β1 for 72 h. F-actin was visualized by TRITC-conjugated phalloidin. Scale bars represent 100 μm. (C) Quantitative analysis of cell morphology of HeLa cells in (B). The lengths of the major and minor cell axes were measured using NIH-Image software. The ratios of the major to minor axes of cells were used to determine the degree of elongated cell morphology. For each experiment, over 20 cells in each condition were measured. Each column represents the mean with standard deviation. (D) qPCR analysis of fibronectin, snail, and slug expression in fad104 knockdown cells. Cells were treated with 1 ng/mL TGF-β1 for 72 h. Expression levels of fibronectin, snail, and slug were normalized with 18 S rRNA expression. Each column represents the mean with standard deviation (n = 3). (E) Protein expression of fibronectin, Snail, and Slug in fad104 knockdown cells. Whole-cell lysates were subjected to Western blot analysis and β-actin was used as a loading control. Signal intensities of the proteins were quantified using NIH-Image software. Each column represents the mean with standard deviation (n = 3). Significant differences are indicated as **p < 0.01.
Figure 4
Figure 4
FAD104 overexpression attenuates TGF-β–mediated EMT in HeLa cells. (A) The effect of FAD104 overexpression on the expression level of EMT-related genes. HeLa cells were infected with FAD104 or LacZ, and treated with 1 ng/mL TGF-β1 for 72 h. Whole-cell lysates were subjected to Western blot analysis and β-actin was used as a loading control. Signal intensities of the proteins were quantified using NIH-Image software. Each column represents the mean with standard deviation (n = 3). Significant differences are indicated as **p < 0.01. (B) Flag-tagged FAD104 expression plasmid was introduced into HeLa cells. After transfection, the cells were treated with 5 ng/mL TGF-β1 for 72 h. The signals of F-actin (red) and Flag-tagged FAD104 (green) were detected with fluorescence microscopy. Arrow indicates the cells expressing Flag-tagged FAD104. Arrowheads indicate untransfected cells as Flag signal is not detected.
Figure 5
Figure 5
Knockdown of fad104 expression enhances the migration of HeLa cells undergoing TGF-β–mediated EMT. HeLa cells were transfected with siRNA targeting fad104 (sifad104-A) and treated with 1 ng/mL TGF-β1 for 72 h. (A) Whole-cell lysates prepared from HeLa cells undergoing EMT were subjected to Western blot analysis. β-Actin was used as a loading control. Arrowhead shows nonspecific bands. (B) Cells undergoing EMT were plated in the upper chamber of the filters coated with fibronectin. Cells that migrated to the underside of the transwell insert were measured after 24 h. Representative images of migrated cells were shown. (C) The mean number of migrated cells in the field was calculated. Each column represents the mean with standard deviation (n = 5). (D) Cells undergoing EMT were plated in culture plates. After 24 h, cells were trypsinized and counted. Each column represents the mean with standard deviation (n = 3). Significant differences are indicated as **p < 0.01 and *p < 0.05.
Figure 6
Figure 6
FAD104 negatively regulates phosphorylation level of Smad3 with TGF-β1 treatment in HeLa cells. (A) Phosphorylation levels of Smad3 in fad104 knockdown HeLa cells. HeLa cells were transfected with siRNA targeting fad104 (sifad104-A) and treated with 1 ng/mL TGF-β1 for 6 h. (B) Phosphorylation levels of Smad3 in HeLa cells overexpressing FAD104. HeLa cells were infected with FAD104 and treated with 1 ng/mL TGF-β1 for 6 h. Whole-cell lysates were subjected to Western blot analysis and β-actin was used as a loading control. Signal intensities from phospho-Smad3, total Smad3, and β-actin were quantified using NIH-Image software. Each column represents the mean with standard deviation (n = 3). Significant differences are indicated as **p < 0.01 and *p < 0.05.
Figure 7
Figure 7
FAD104 positively regulates phosphorylation level of Smad1/5/8 with TGF-β1 treatment in HeLa cells. (A) Phosphorylation levels of Smad1/5/8 in fad104 knockdown HeLa cells. HeLa cells were transfected with siRNA targeting fad104 (sifad104-A) and treated with 1 ng/mL TGF-β1 for 30 min. (B) Phosphorylation levels of Smad1/5/8 in HeLa cells overexpressing FAD104. HeLa cells were infected with FAD104 and treated with 1 ng/mL TGF-β1 for 30 min. Whole-cell lysates were subjected to Western blot analysis and β-actin was used as a loading control. Signal intensities from phospho-Smad1/5/8, total Smad1/5/8, and β-actin were quantified using NIH-Image software. Each column represents the mean with standard deviation (n = 3). Significant differences are indicated as **p < 0.01.

Similar articles

Cited by

References

    1. Pandya P, Orgaz JL, Sanz-Moreno V. Modes of invasion during tumour dissemination. Mol. Oncol. 2017;11:5–27. doi: 10.1002/1878-0261.12019. - DOI - PMC - PubMed
    1. Gupta GP, Massagué J. Cancer metastasis: building a framework. Cell. 2006;127:679–695. doi: 10.1016/j.cell.2006.11.001. - DOI - PubMed
    1. Valastyan S, Weinberg RA. Tumor metastasis: molecular insights and evolving paradigms. Cell. 2011;147:275–292. doi: 10.1016/j.cell.2011.09.024. - DOI - PMC - PubMed
    1. Becker A, et al. Extracellular Vesicles in Cancer: Cell-to-Cell Mediators of Metastasis. Cancer Cell. 2016;30:836–848. doi: 10.1016/j.ccell.2016.10.009. - DOI - PMC - PubMed
    1. Smith BN, Bhowmick NA. Role of EMT in Metastasis and Therapy Resistance. J. Clin. Med. 2016;5:E17. doi: 10.3390/jcm5020017. - DOI - PMC - PubMed

Publication types