

Persistent inhibition of pore-based cell migration by sub-toxic doses of miuraenamide, an actin filament stabilizer
- PMID: 29180826
- PMCID: PMC5703899
- DOI: 10.1038/s41598-017-16759-7
Persistent inhibition of pore-based cell migration by sub-toxic doses of miuraenamide, an actin filament stabilizer
Abstract
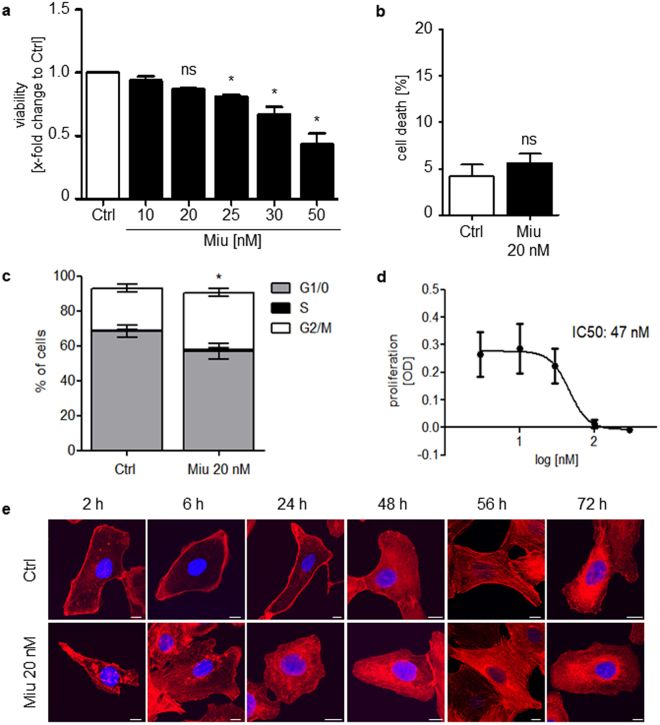
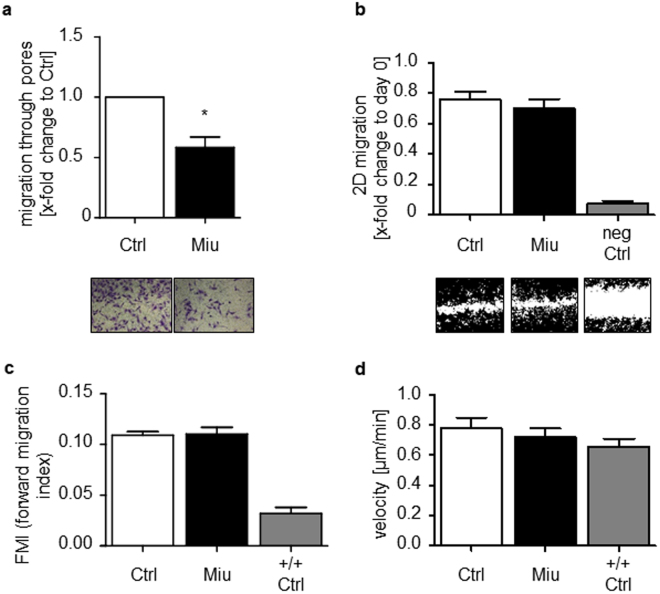
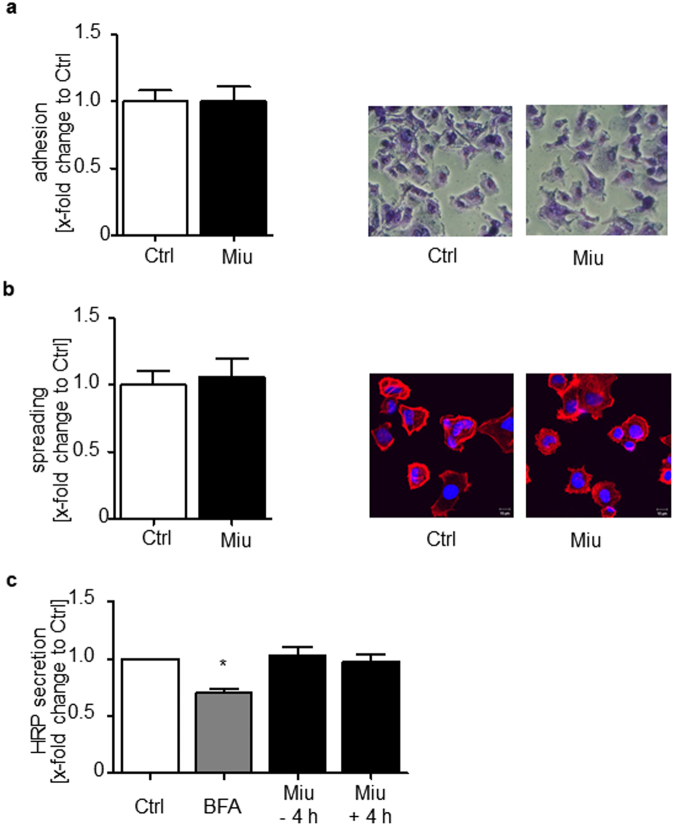
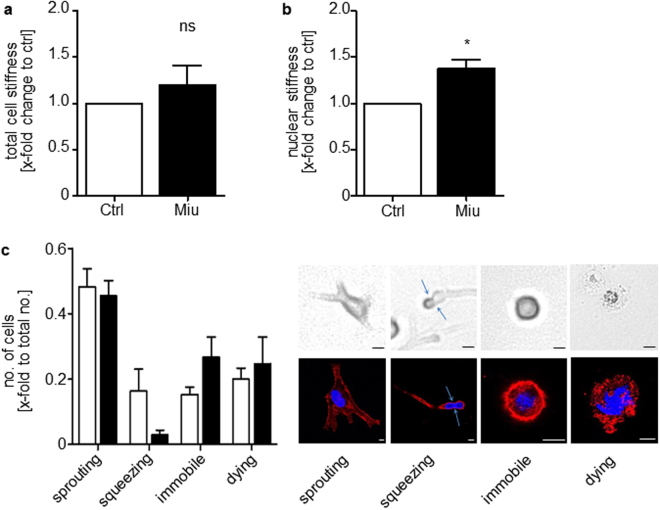
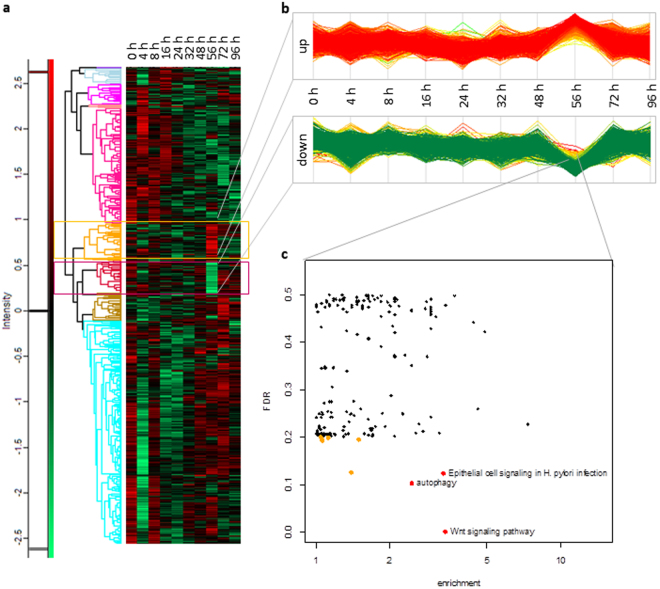
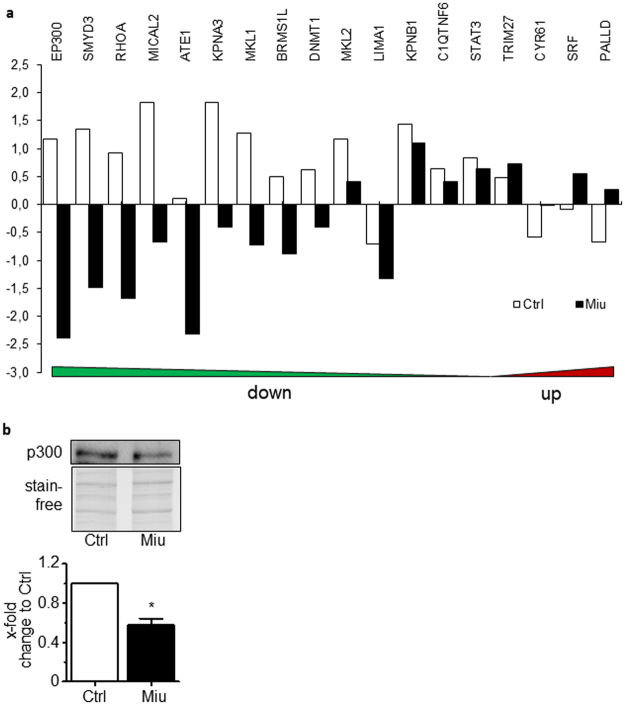
Opposed to tubulin-binding agents, actin-binding small molecules have not yet become part of clinical tumor treatment, most likely due to the fear of general cytotoxicity. Addressing this problem, we investigated the long-term efficacy of sub-toxic doses of miuraenamide, an actin filament stabilizing natural compound, on tumor cell (SKOV3) migration. No cytotoxic effects or persistent morphological changes occurred at a concentration of miuraenamide of 20 nM. After 72 h treatment with this concentration, nuclear stiffness was increased, causing reduced migration through pores in a Boyden chamber, while cell migration and chemotaxis per se were unaltered. A concomitant time-resolved proteomic approach showed down regulation of a protein cluster after 56 h treatment. This cluster correlated best with the Wnt signaling pathway. A further analysis of the actin associated MRTF/SRF signaling showed a surprising reduction of SRF-regulated proteins. In contrast to acute effects of actin-binding compounds on actin at high concentrations, long-term low-dose treatment elicits much more subtle but still functionally relevant changes beyond simple destruction of the cytoskeleton. These range from biophysical parameters to regulation of protein expression, and may help to better understand the complex biology of actin, as well as to initiate alternative regimes for the testing of actin-targeting drugs.
Conflict of interest statement
The authors declare that they have no competing interests.
Figures
Similar articles
-
Actin stabilizing compounds show specific biological effects due to their binding mode.Sci Rep. 2019 Jul 5;9(1):9731. doi: 10.1038/s41598-019-46282-w. Sci Rep. 2019. PMID: 31278311 Free PMC article.
-
In vitro and in vivo characterization of the actin polymerizing compound chondramide as an angiogenic inhibitor.Cardiovasc Res. 2014 Nov 1;104(2):303-14. doi: 10.1093/cvr/cvu210. Epub 2014 Sep 19. Cardiovasc Res. 2014. PMID: 25239826
-
Cell-morphology profiling of a natural product library identifies bisebromoamide and miuraenamide A as actin filament stabilizers.ACS Chem Biol. 2011 May 20;6(5):425-31. doi: 10.1021/cb1003459. Epub 2011 Feb 24. ACS Chem Biol. 2011. PMID: 21322638
-
The actin targeting compound Chondramide inhibits breast cancer metastasis via reduction of cellular contractility.PLoS One. 2014 Nov 12;9(11):e112542. doi: 10.1371/journal.pone.0112542. eCollection 2014. PLoS One. 2014. PMID: 25391145 Free PMC article.
-
The role of phosphoinositide-regulated actin reorganization in chemotaxis and cell migration.Br J Pharmacol. 2014 Dec;171(24):5541-54. doi: 10.1111/bph.12777. Epub 2014 Nov 24. Br J Pharmacol. 2014. PMID: 25420930 Free PMC article. Review.
Cited by
-
Depsipeptides Targeting Tumor Cells: Milestones from In Vitro to Clinical Trials.Molecules. 2023 Jan 9;28(2):670. doi: 10.3390/molecules28020670. Molecules. 2023. PMID: 36677728 Free PMC article. Review.
-
Actin stabilization in cell migration.Front Cell Dev Biol. 2022 Aug 11;10:931880. doi: 10.3389/fcell.2022.931880. eCollection 2022. Front Cell Dev Biol. 2022. PMID: 36035985 Free PMC article.
-
Actin stabilizing compounds show specific biological effects due to their binding mode.Sci Rep. 2019 Jul 5;9(1):9731. doi: 10.1038/s41598-019-46282-w. Sci Rep. 2019. PMID: 31278311 Free PMC article.
-
Genomic Analysis of the Rare Slightly Halophilic Myxobacterium "Paraliomyxa miuraensis" SMH-27-4, the Producer of the Antibiotic Miuraenamide A.Microorganisms. 2023 Feb 1;11(2):371. doi: 10.3390/microorganisms11020371. Microorganisms. 2023. PMID: 36838335 Free PMC article.
-
Synthesis and Late-Stage Modification of (-)-Doliculide Derivatives Using Matteson's Homologation Approach.Mar Drugs. 2024 Apr 8;22(4):165. doi: 10.3390/md22040165. Mar Drugs. 2024. PMID: 38667782 Free PMC article.
References
-
- Bubb MR, Senderowicz AM, Sausville EA, Duncan KL, Korn ED. Jasplakinolide, a cytotoxic natural product, induces actin polymerization and competitively inhibits the binding of phalloidin to F-actin. J Biol Chem. 1994;269:14869–14871. - PubMed
Publication types
MeSH terms
Substances
LinkOut - more resources
Full Text Sources
Other Literature Sources
Molecular Biology Databases
Miscellaneous
