. 2017:2017:3524208.
doi: 10.1155/2017/3524208. Epub 2017 Oct 18.

Mental Task Evaluation for Hybrid NIRS-EEG Brain-Computer Interfaces

Affiliations

Mental Task Evaluation for Hybrid NIRS-EEG Brain-Computer Interfaces

Hubert Banville et al. Comput Intell Neurosci. 2017.

Abstract

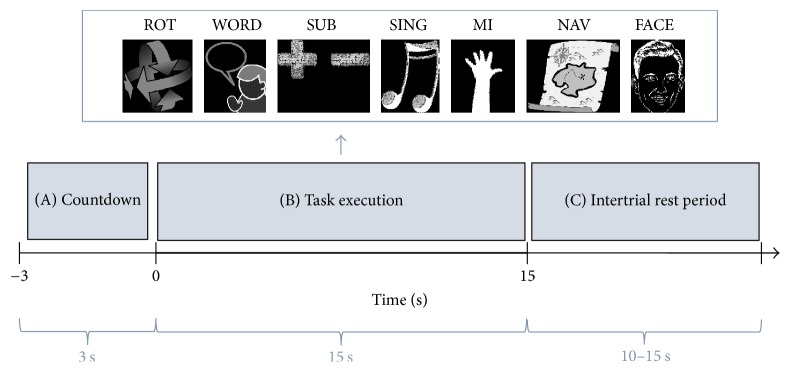
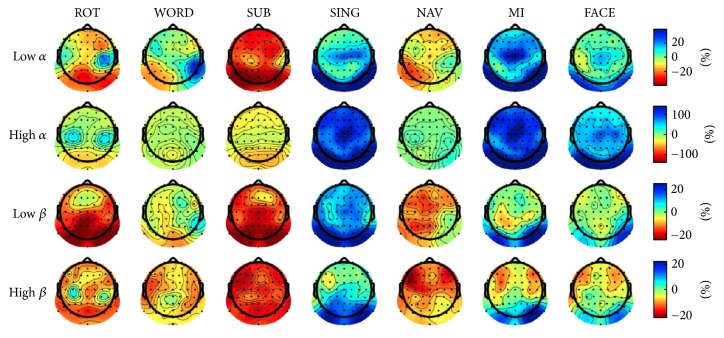
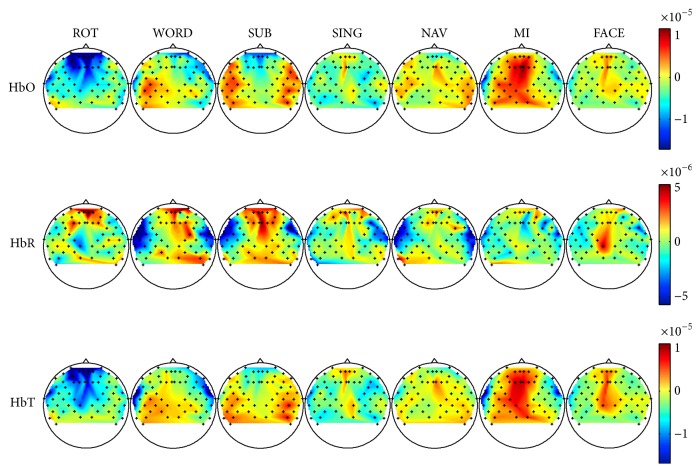
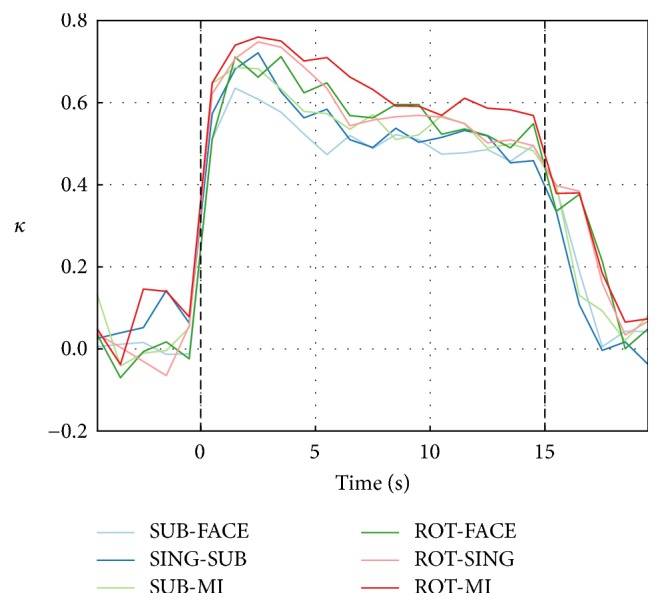
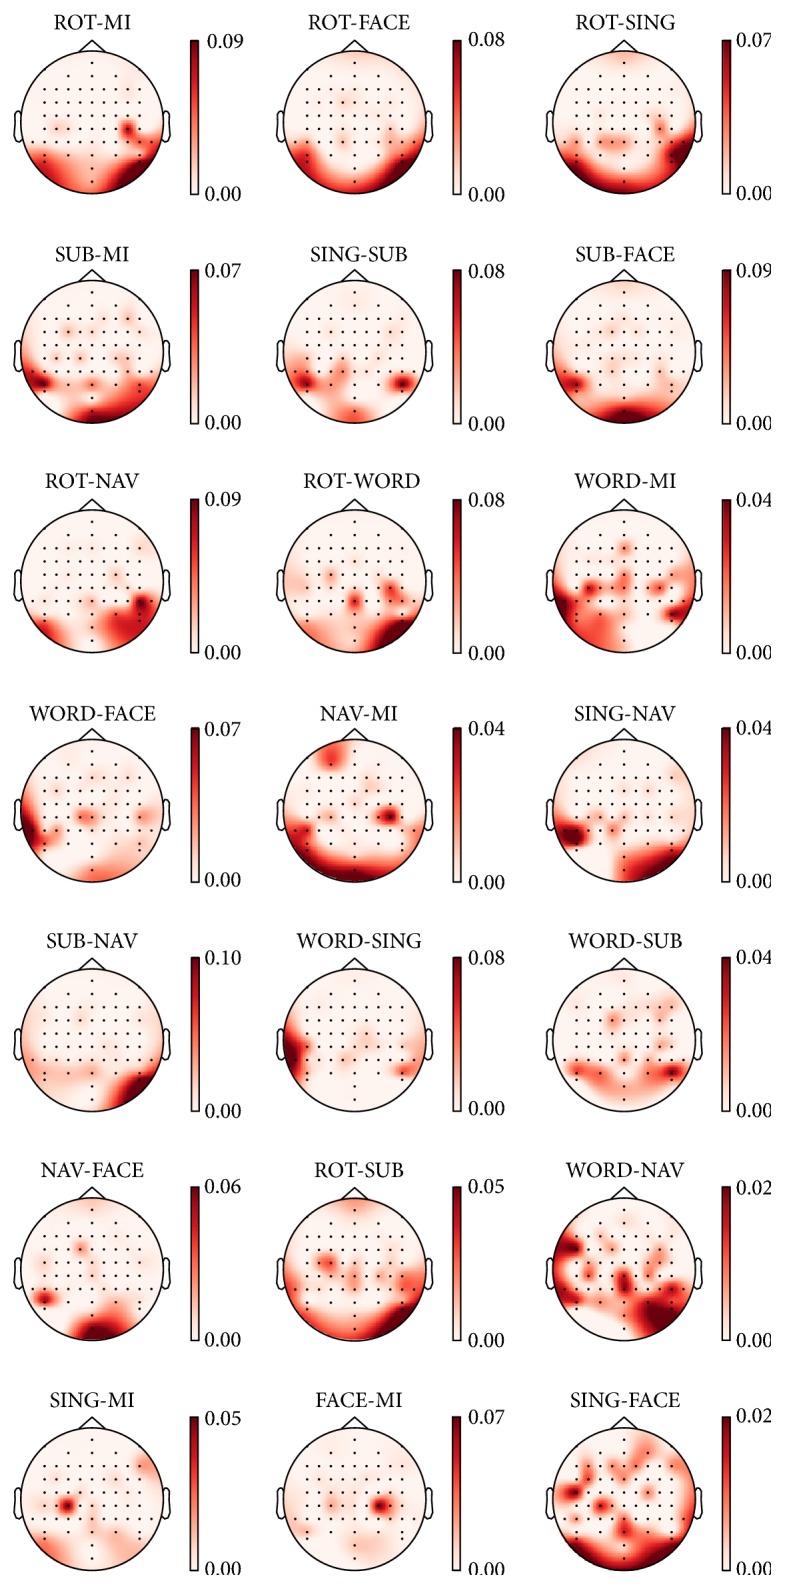
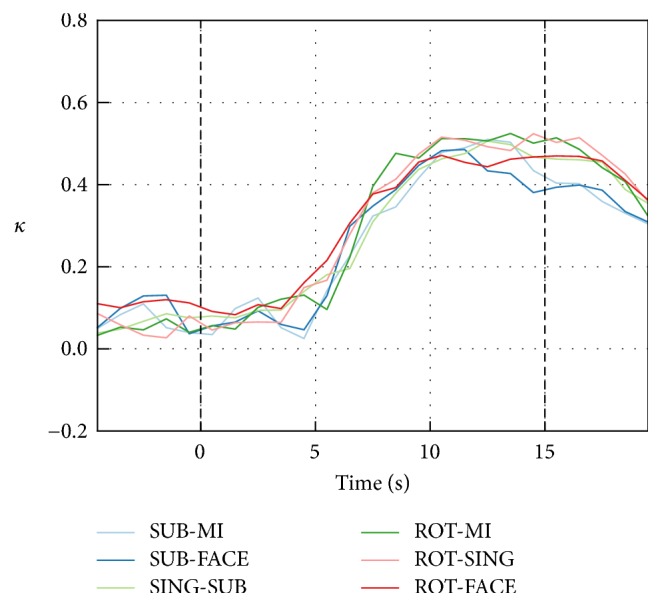
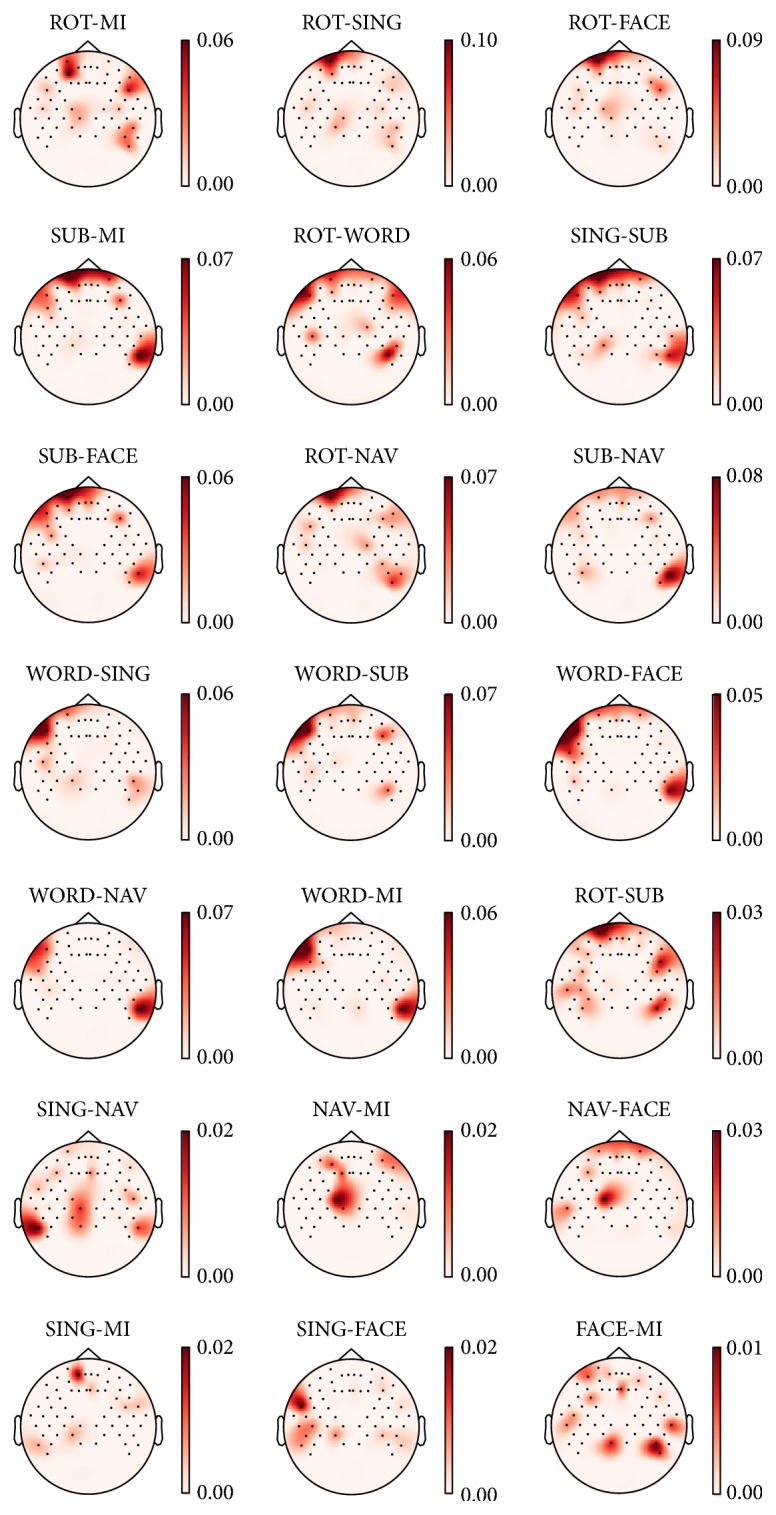
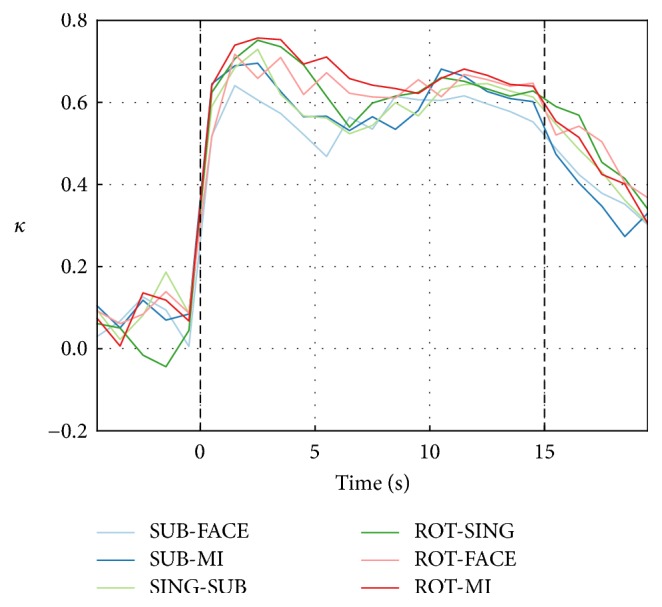
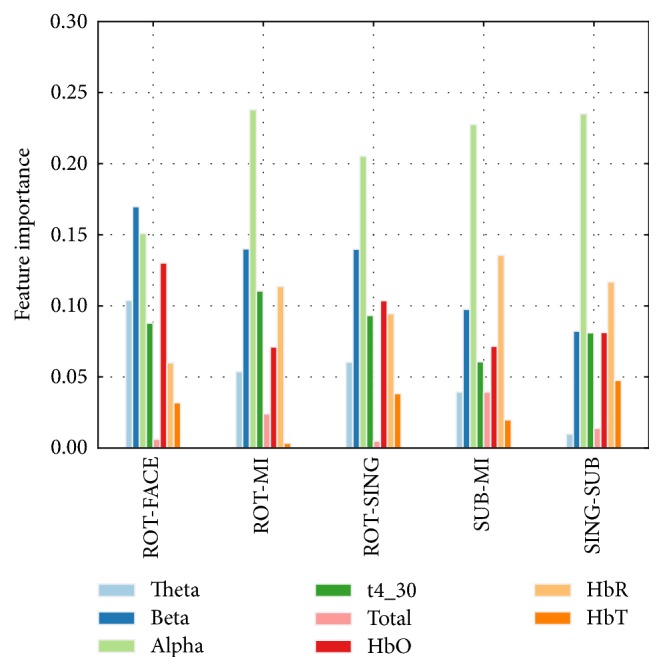
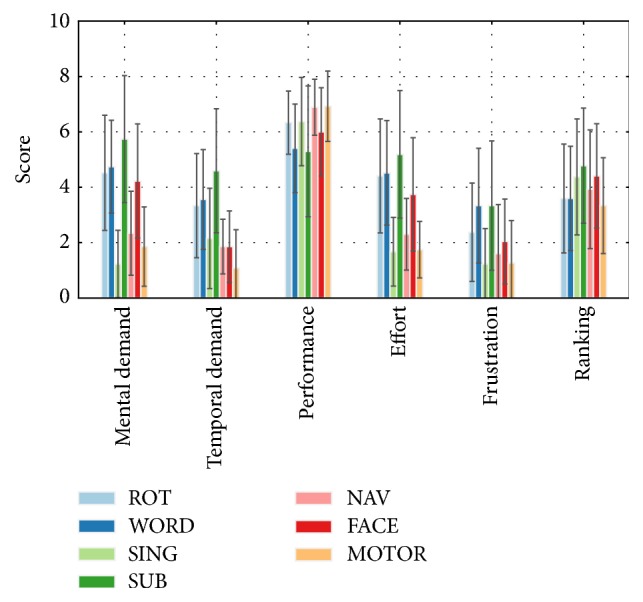
Based on recent electroencephalography (EEG) and near-infrared spectroscopy (NIRS) studies that showed that tasks such as motor imagery and mental arithmetic induce specific neural response patterns, we propose a hybrid brain-computer interface (hBCI) paradigm in which EEG and NIRS data are fused to improve binary classification performance. We recorded simultaneous NIRS-EEG data from nine participants performing seven mental tasks (word generation, mental rotation, subtraction, singing and navigation, and motor and face imagery). Classifiers were trained for each possible pair of tasks using (1) EEG features alone, (2) NIRS features alone, and (3) EEG and NIRS features combined, to identify the best task pairs and assess the usefulness of a multimodal approach. The NIRS-EEG approach led to an average increase in peak kappa of 0.03 when using features extracted from one-second windows (equivalent to an increase of 1.5% in classification accuracy for balanced classes). The increase was much stronger (0.20, corresponding to an 10% accuracy increase) when focusing on time windows of high NIRS performance. The EEG and NIRS analyses further unveiled relevant brain regions and important feature types. This work provides a basis for future NIRS-EEG hBCI studies aiming to improve classification performance toward more efficient and flexible BCIs.


Figures

Figure 1
Figure 1
Diagram of a trial of the experimental paradigm. A trial is composed of (A) a 3 s countdown period in which participants are instructed about the coming mental task, (B) an imagery period where they execute the given task for 15 s, and (C) a randomized 10 to 15 s rest period.
Figure 2
Figure 2
EEG and NIRS topology used in this study (adapted from [59]). EEG electrodes (black rectangles), NIRS detectors (red circles), and NIRS sources (green diamonds) were placed following the 10-5 system. NIRS channels are represented by dark straight lines connecting the sources to the detectors. Brain regions used to compute artificial NIRS channels are grouped in light blue.
Figure 3
Figure 3
ERD/ERS maps for each task in the low α, high α, low β, and high β bands. ERD/ERS values are computed using the intertrial variance method [51] over the time window spanning 0.5 to two seconds after stimulus onset, using a baseline of −2 to 0 seconds before trial onset. Blue represents ERS while red represents ERD. Note that color ranges differ between power bands.
Figure 4
Figure 4
Average HbO, HbR, and HbT maps for each task. Reported HbO, HbR, and HbT values are normalized to their baseline values and averaged across the time window spanning 10 to 15 seconds after stimulus onset. Red represents an increase in concentration of the chromophore, while blue represents a decrease (in mmol/L).
Figure 5
Figure 5
EEG-only classification κ over nonoverlapping one-second windows for the six best task pairs. The classification κ obtained with one-second windows was averaged over participants for each task pair. Each point is aligned with the middle of the window from which the features were extracted. Baseline κ values were not significantly greater than 0 (one-tailed t-tests).
Figure 6
Figure 6
Topographical maps of the average absolute value of the SVM weights, when trained on EEG features only. Darker regions are those that are more important when classifying each task pair. Note that distinct color ranges are used for each map. This figure uses the models trained on the one-second window occurring three to four seconds after stimulus onset, which corresponds to the average peak time for EEG classification (see Table 2). The pairs are plotted in descending order of average κ (left to right and top to bottom) as presented in Table 2.
Figure 7
Figure 7
NIRS-only classification κ over nonoverlapping one-second windows for the six best task pairs. The classification κ obtained with one-second windows was averaged over participants for each task pair. Each point is aligned with the middle of the window from which the features were extracted. Baseline κ values were not significantly greater than 0 (one-tailed t-tests).
Figure 8
Figure 8
Topographical maps of the average absolute value of the SVM weights, when trained on NIRS features only. Darker regions are those that are more important when classifying each task pair. Note that distinct color ranges are used for each map. This figure uses the models trained on the one-second window occurring 11 to 12 seconds after stimulus onset, which corresponds to the average peak time for NIRS classification (see Table 4). The pairs are plotted in descending order of average κ (from left to right and top to bottom) as presented in Table 4.
Figure 9
Figure 9
EEG and NIRS classification κ over nonoverlapping one-second windows for the six best task pairs. The classification κ obtained with one-second windows was averaged over participants for each task pair. Each point is aligned with the middle of the window from which the features were extracted. Baseline κ values were not significantly greater than 0 (one-tailed t-tests).
Figure 10
Figure 10
Importance of each EEG and NIRS feature subtype: EEG band powers (θ, α, β, 4–30 Hz, and total spectrum (0.1–100 Hz)) and chromophore types (HbO, HbR, and HbT). The histogram is based on the models trained on the one-second window occurring 11 to 12 seconds after stimulus onset, which corresponds to the average peak time for NIRS classification (see Table 4).
Figure 11
Figure 11
NASA TLX ratings and mental task ranking. Ratings and rankings are averaged over each subject and session. Error bars correspond to the standard deviation of each group of rating and mental task.

References

    1. Wolpaw J. R., Birbaumer N., McFarland D. J., Pfurtscheller G., Vaughan T. M. Brain-computer interfaces for communication and control. Clinical Neurophysiology. 2002;113(6):767–791. doi: 10.1016/S1388-2457(02)00057-3. - DOI - PubMed
    1. Wolpaw J. R., Wolpaw E. W. Brain-Computer Interfaces: Principles and Practice. Oxford University Press; 2012. Brain-computer interfaces: something new under the sun; pp. 3–12. - DOI
    1. Van Erp J. B. F., Lotte F., Tangermann M. Brain-computer interfaces: beyond medical applications. Computer. 2012;45(4):26–34. doi: 10.1109/mc.2012.107. - DOI
    1. Coyle S. M., Ward T. E., Markham C. M., McDarby G. On the suitability of near-infrared (NIR) systems for next-generation brain-computer interfaces. Physiological Measurement. 2004;25(4, article 815) doi: 10.1088/0967-3334/25/4/003. - DOI - PubMed
    1. Hwang H.-J., Kim S., Choi S., Im C.-H. EEG-based brain-computer interfaces: a thorough literature survey. International Journal of Human-Computer Interaction. 2013;29(12):814–826. doi: 10.1080/10447318.2013.780869. - DOI

LinkOut - more resources