Association Between Neonatal Intensive Care Unit Admission Rates and Illness Acuity
- PMID: 29181499
- PMCID: PMC5833518
- DOI: 10.1001/jamapediatrics.2017.3913
Association Between Neonatal Intensive Care Unit Admission Rates and Illness Acuity
Abstract
Importance: Most neonates admitted to a neonatal intensive care unit (NICU) are born at gestational age (GA) of 34 weeks or more. The degree of uniformity of admission criteria for these infants is unclear, particularly at the low-acuity end of the range of conditions warranting admission.
Objectives: To describe variation in NICU admission rates for neonates born at GA of 34 weeks or more and examine whether such variation is associated with high illness acuity or designated facility level of care.
Design, setting, and participants: Cross-sectional study of 35 921 NICU inborn admissions of GA at 34 weeks or more during calendar year 2015, using a population database of inborn NICU admissions at 130 of the 149 hospitals in California with a NICU. The aggregate service population comprised 358 453 live births. The individual NICU was the unit of observation and analysis. The analysis was stratified by designated facility level of care and correlations with the percentage admissions with high illness acuity were explored. The hypothesis at the outset of the study was that inborn admission rates would correlate positively with the percentage of admissions with high illness acuity.
Exposures: Live birth at GA of 34 weeks or more.
Main outcomes and measures: Inborn NICU admission rate.
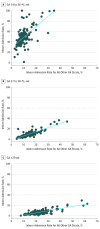
Results: Of the total of 358 453 live births at GA of 34 weeks or more, 35 921 infants were admitted to a NICU and accounted for 79.2% of all inborn NICU admissions; 4260 (11.9%) of these admissions met high illness acuity criteria. Inborn admission rates varied 34-fold, from 1.1% to 37.7% of births (median, 9.7%; mean [SD], 10.6% [5.8%]). Percentage with high illness acuity varied 40-fold, from 2.4% to 95% (median, 11.3%; mean, 13.2% [9.9%]). Inborn admission rate correlated inversely with percentage of admissions with high illness acuity (Spearman ρ = -0.3034, P < .001). Among regional NICUs capable of caring for patients with the highest degree of illness and support needs, inborn admission rate did not significantly correlate with percentage of admissions with high illness acuity (Spearman ρ = -0.21, P = .41).
Conclusions and relevance: Percentage of admissions with high illness acuity does not explain 34-fold variation in NICU inborn admission rates for neonates born at GA of 34 weeks or more. The findings are consistent with a supply-sensitive care component and invite future investigation to clarify the lower-acuity end of the range of conditions considered to warrant neonatal intensive care.
Conflict of interest statement
Figures


Comment in
-
Data Deficiency in an Era of Expanding Neonatal Intensive Care Unit Care.JAMA Pediatr. 2018 Jan 1;172(1):11-12. doi: 10.1001/jamapediatrics.2017.4042. JAMA Pediatr. 2018. PMID: 29181538 No abstract available.
References
-
- Harrison W, Goodman D. Epidemiologic trends in neonatal intensive care, 2007-2012. JAMA Pediatr. 2015;169(9):855-862. - PubMed
-
- Carroll AE. The concern for supply-sensitive neonatal intensive care unit care: if you build them, they will come. JAMA Pediatr. 2015;169(9):812-813. - PubMed
-
- American Academy of Pediatrics Committee on Fetus and Newborn Levels of neonatal care. Pediatrics. 2012;130(3):587-597. - PubMed
-
- Hynan MT, Mounts KO, Vanderbilt DL. Screening parents of high-risk infants for emotional distress: rationale and recommendations. J Perinatol. 2013;33(10):748-753. - PubMed
-
- Moolenaar RL, Crutcher JM, San Joaquin VH, et al. A prolonged outbreak of Pseudomonas aeruginosa in a neonatal intensive care unit: did staff fingernails play a role in disease transmission? Infect Control Hosp Epidemiol. 2000;21(2):80-85. - PubMed
Publication types
MeSH terms
Grants and funding
LinkOut - more resources
Full Text Sources
Other Literature Sources
Miscellaneous

