

A Multivariate Analytic Approach to the Differential Diagnosis of Apraxia of Speech
- PMID: 29181537
- PMCID: PMC6111519
- DOI: 10.1044/2017_JSLHR-S-16-0443
A Multivariate Analytic Approach to the Differential Diagnosis of Apraxia of Speech
Abstract
Purpose: Apraxia of speech (AOS) is a consequence of stroke that frequently co-occurs with aphasia. Its study is limited by difficulties with its perceptual evaluation and dissociation from co-occurring impairments. This study examined the classification accuracy of several acoustic measures for the differential diagnosis of AOS in a sample of stroke survivors.
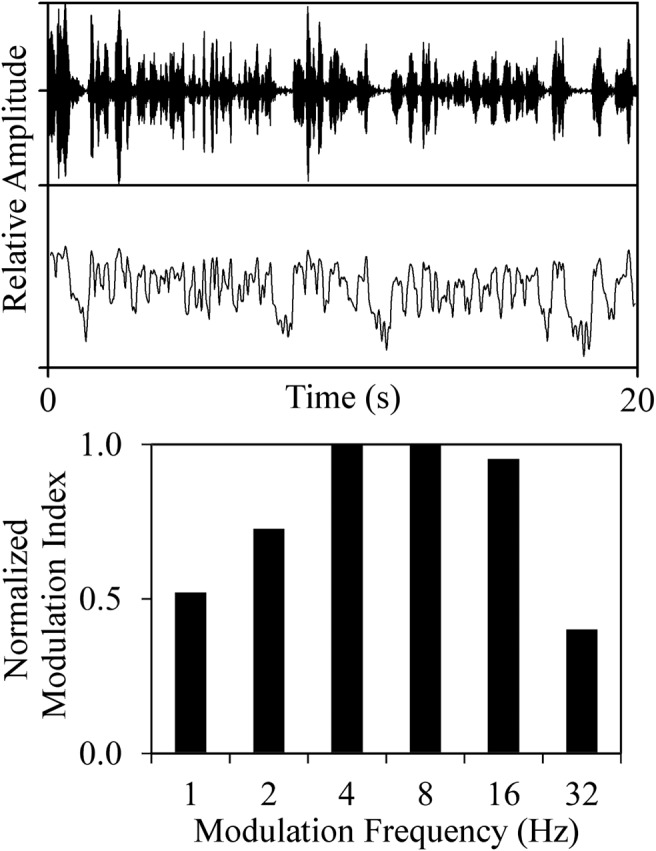
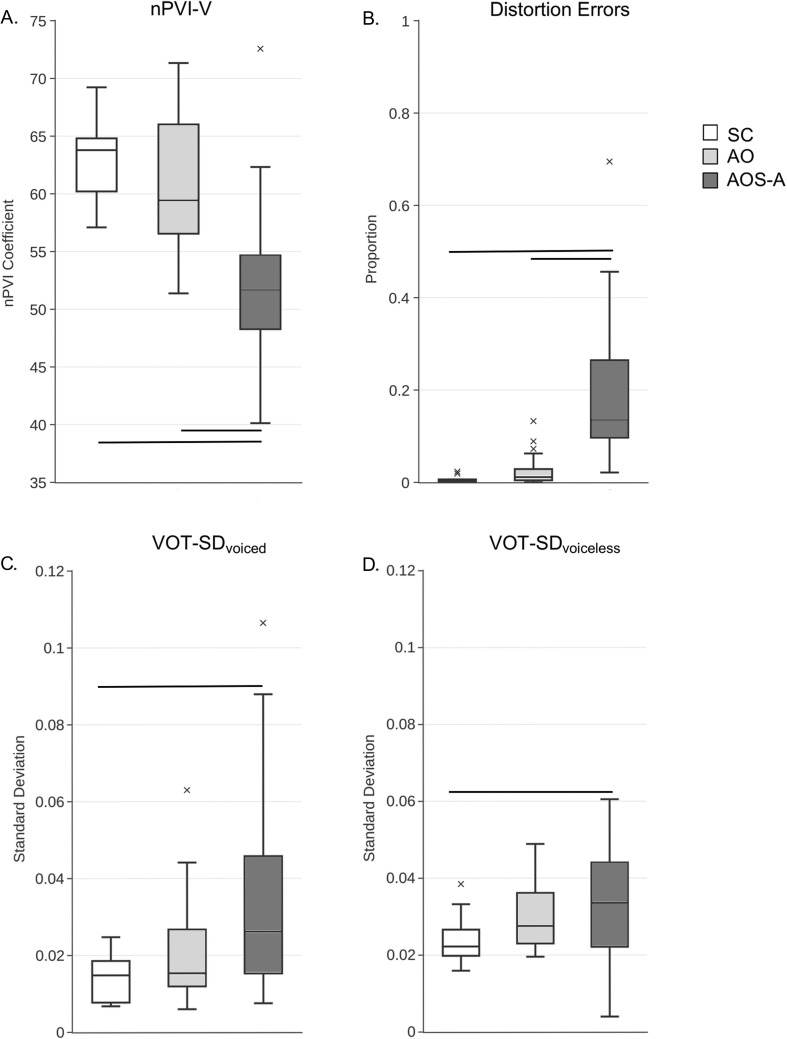
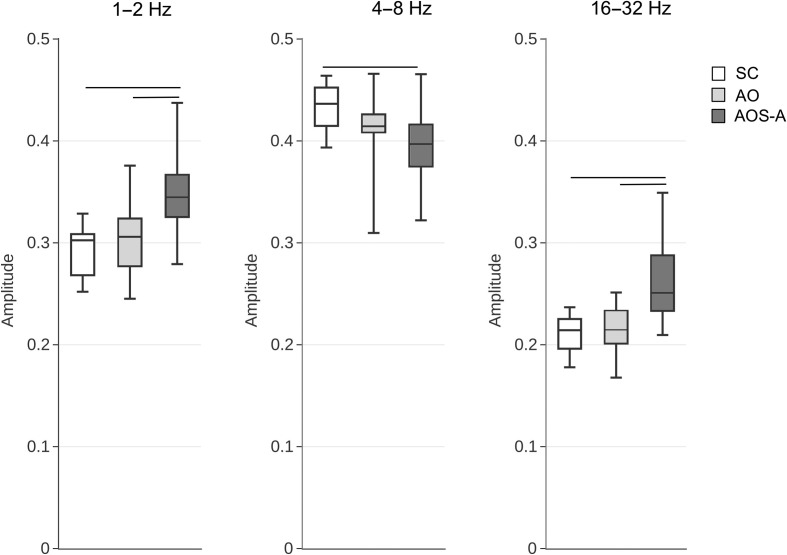
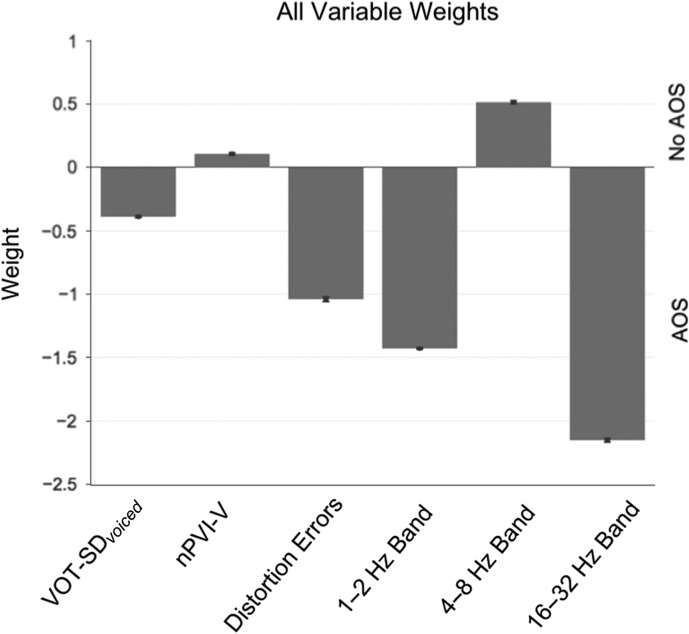
Method: Fifty-seven individuals were included (mean age = 60.8 ± 10.4 years; 21 women, 36 men; mean months poststroke = 54.7 ± 46). Participants were grouped on the basis of speech/language testing as follows: AOS-Aphasia (n = 20), Aphasia Only (n = 24), and Stroke Control (n = 13). Normalized Pairwise Variability Index, proportion of distortion errors, voice onset time variability, and amplitude envelope modulation spectrum variables were obtained from connected speech samples. Measures were analyzed for group differences and entered into a linear discriminant analysis to predict diagnostic classification.
Results: Out-of-sample classification accuracy of all measures was over 90%. The envelope modulation spectrum variables had the greatest impact on classification when all measures were analyzed together.
Conclusions: This study contributes to efforts to identify objective acoustic measures that can facilitate the differential diagnosis of AOS. Results suggest that further study of these measures is warranted to determine the best predictors of AOS diagnosis.
Supplemental materials: https://doi.org/10.23641/asha.5611309.
Figures
References
-
- Arvaniti A. (2012). The usefulness of metrics in the quantification of speech rhythm. Journal of Phonetics, 40(3), 351–373.
-
- Ballard K. J., Azizi L., Duffy J., McNeil M. R., Halaki M., O'Dwyer N., … Robin D. A. (2016). A predictive model for diagnosing stroke-related apraxia of speech. Neuropsychologia, 81, 129–139. - PubMed
-
- Ballard K. J., Granier J. P., & Robin D. A. (2000). Understanding the nature of apraxia of speech: Theory, analysis and treatment. Aphasiology, 14(10), 969–995.
-
- Basilakos A., Rorden C., Bonilha L., Moser D., & Fridriksson J. (2015). Patterns of poststroke brain damage that predict speech production errors in apraxia of speech and aphasia dissociate. Stroke, 46(6), 1561–1566. https://doi.org/10.1161/STROKEAHA.115.009211 - PMC - PubMed
-
- Boersma P., & Weenink D. (2001). Praat: A system for doing phonetics by computer [Computer program]. Retrieved from http://www.praat.org
Publication types
MeSH terms
Grants and funding
LinkOut - more resources
Full Text Sources
Other Literature Sources
Medical
